HI!
I am setting up a file with the colibri component to run a parametric analysis and I am using ASE, Annual and sDA components to read the results of each simulation.
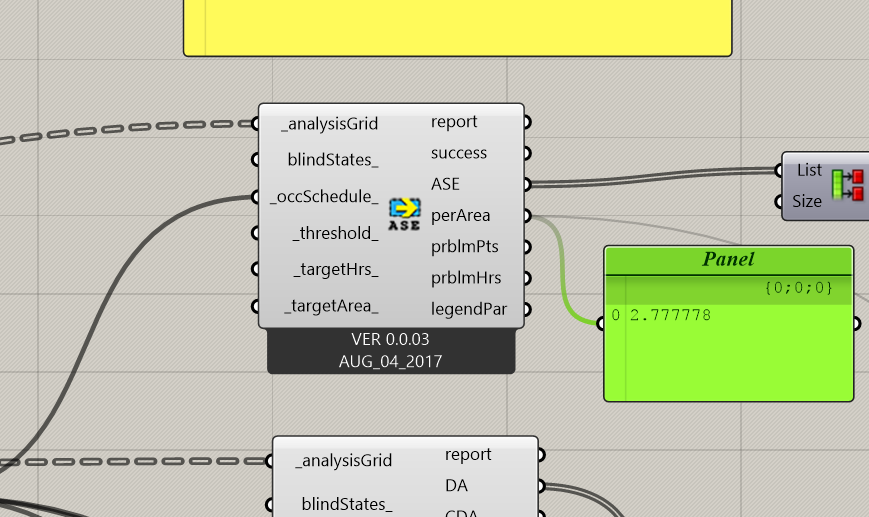
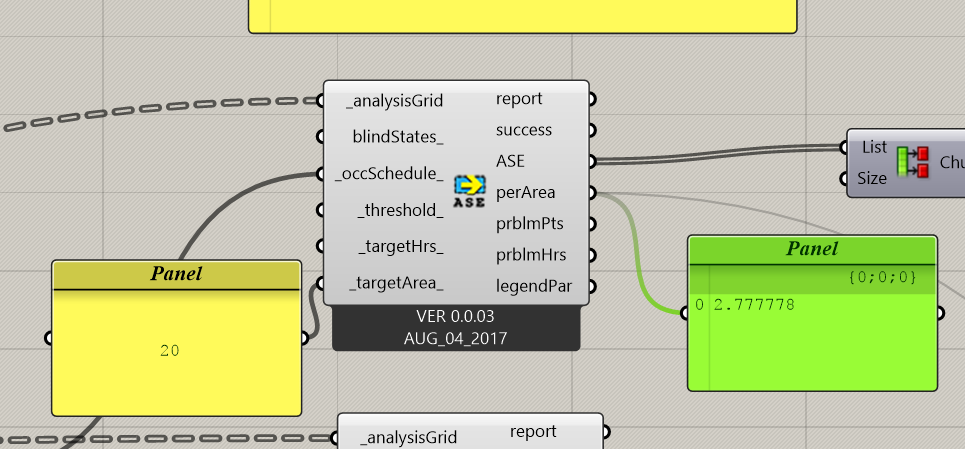
With the ASE I would like not only to record the value of each test point, but also the ASE per area of 10% and also 20%.
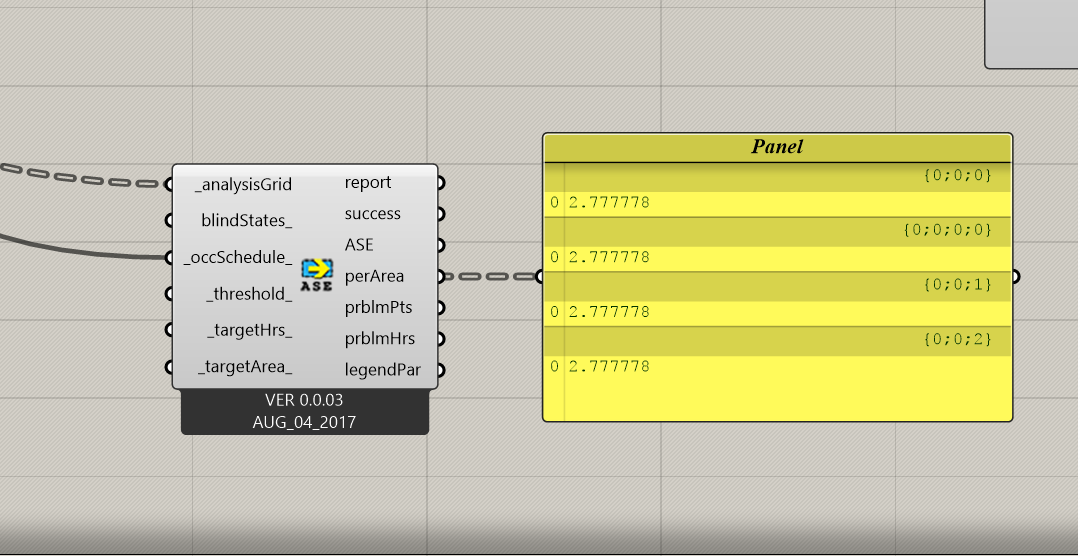
As you can see in the screenshots I attached although I changed the value to 20%, the result is the same as the 10%. That can be possible, so I tried to input random values from 1 to 90 but the result stays the same. So while checking to find the error, I start to connect another ASE component that gives me 4 results. Although I have only one grid, and the Run simulation component output 4 results, in one of the ASE that I used just one result is output, in the another ASE component the 4 results are outputted.
So basically two issue here: one regarding the change of surface for the ASE per area, the other regarding the 4 parameters outputted.
Any help would be fantastic.
Bests,
Federico
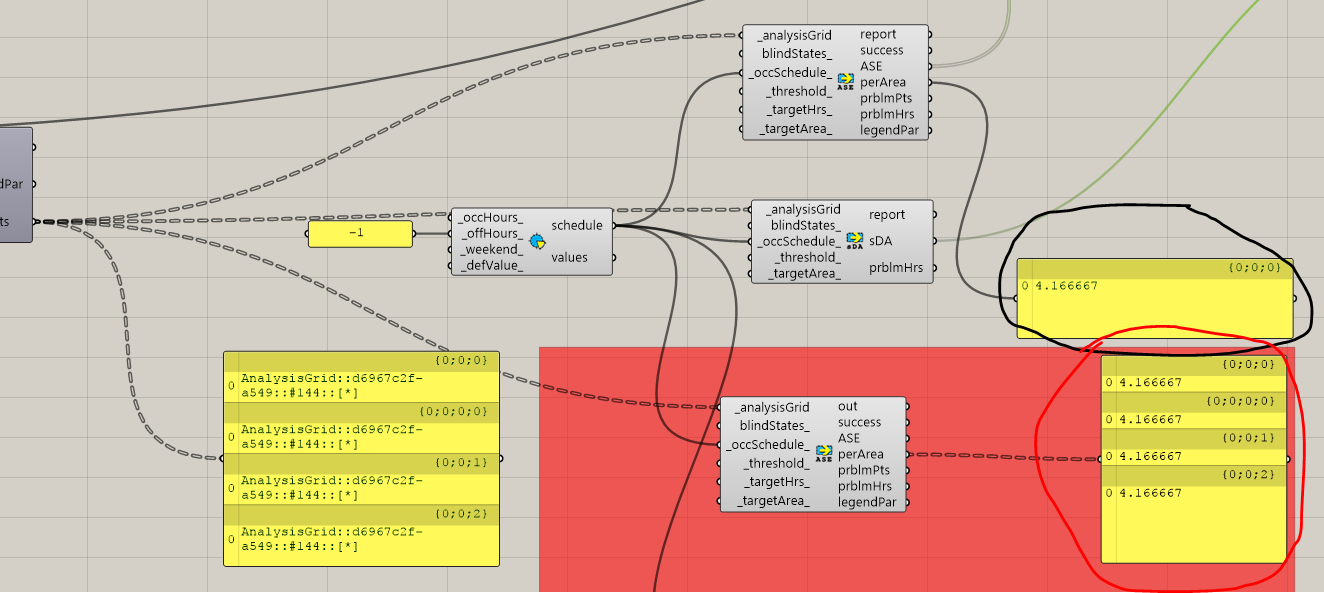
If you have only one Grid you’re making a mistake in setting up the model. As you can see in the results your script is generating four copies of the analysis grid and not one!
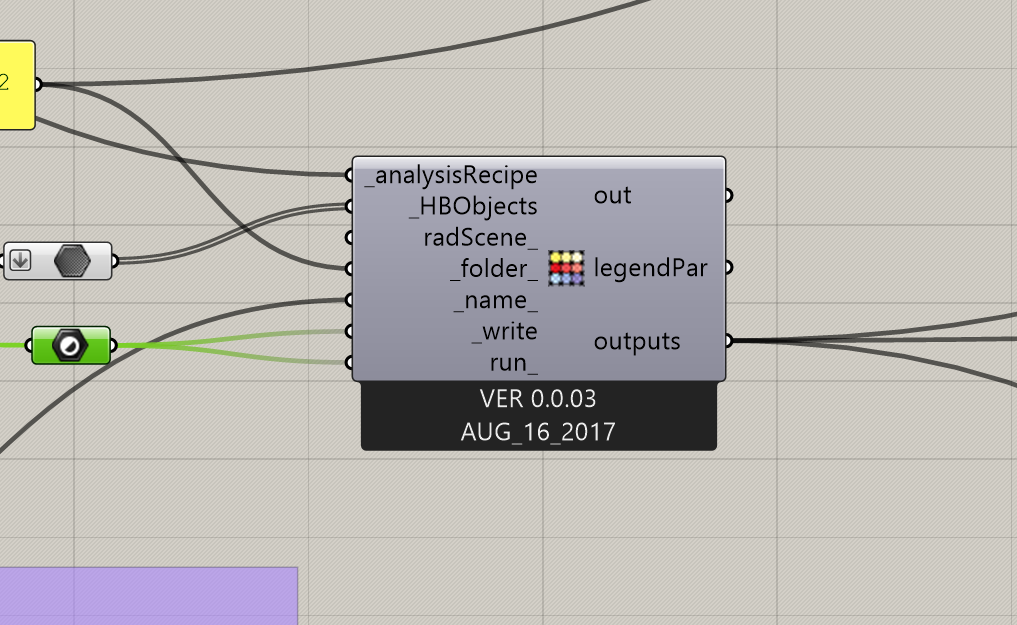
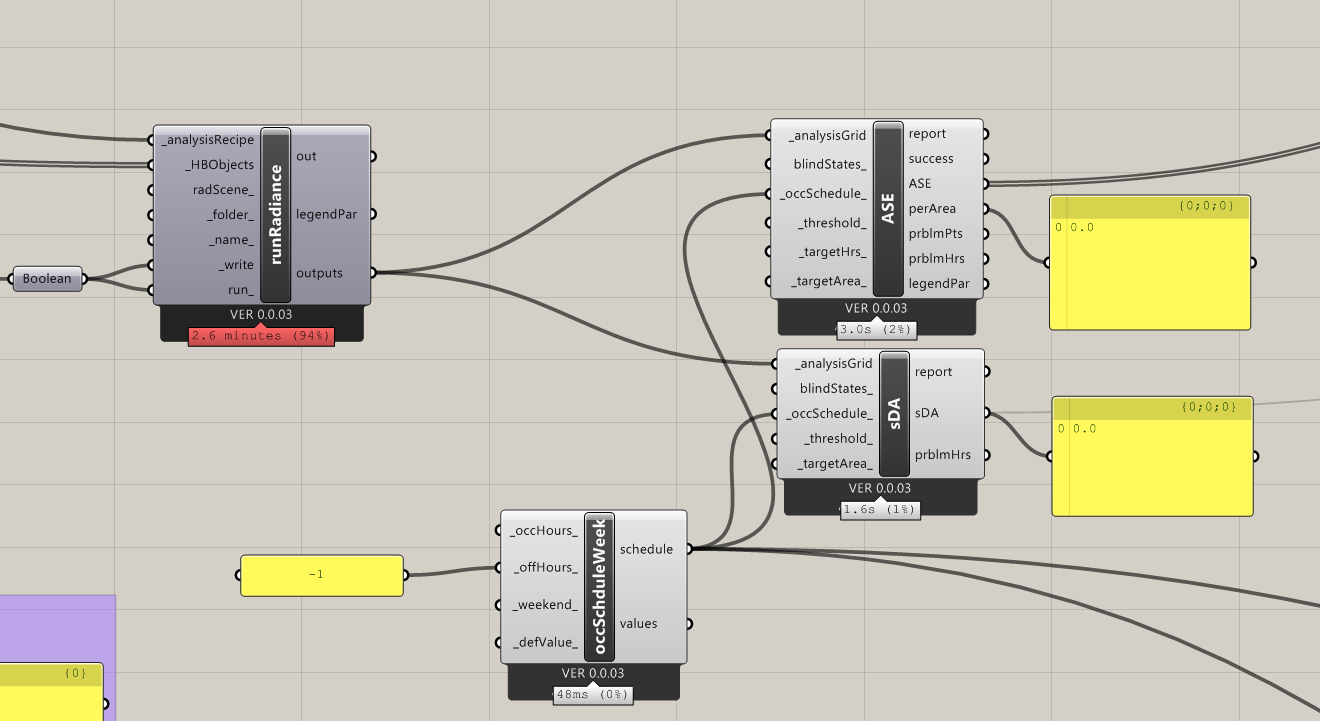
Can you share a screenshot of run radiance component? I think that you’re probably connecting a list with 4 items to an input with item access.
Hi @mostapha,
thanks for taking time to look at this.
Here is the screen shot you aked.
A part of this what about the other issue of the ASE per area that does not changed when changing the target area parameter?
Best,
Federico
This also looks right. What about where you create the analysis grid and the recipe?
Hi @mostapha,
I enclose the file so you can have a look at it.
The orange group on the bottom right of the canvas is the one having the issue.
I tried different things to see if there was a mistake in my end and I could not see any.
Although I saw that if the ASE component is connected before running the simulation, it output correctly just one result. If you connect the component after the simulation, 4 results are shown.
From the run simulation component although 4 results are outputted.
Thanks for having a look at this.
Best regards,
Federico
2017.12.16_B_Discourse.gh (516.1 KB)
Thanks for checking! I have a newer version of Honeybee[+] and it’s really challenging to check the old versions.
thanks @MingboPeng for having a look at it.
-
I check it with different computers but with me is the same as shown before: 4 grids are outputted; when the result component is connected prior of the simulation just one surface is consider, otherwise all 4 are showed (attached pics: black circle connected before, red connected after simualtion).
It is not a big deal, I have just to connect all the component before running the simulation.
-
this was a misunderstanding on my part
@mostapha, I am very intrigued to test this new version! Any info about when it is gonna be available?
Thanks for the support,
Federico