Does Ladybug use this script to calculate the illuminance values or should these be supplied by the EPW files?
@mrbro, for some compliance work (but I’m not familiar with LEED) it is sufficient to use the constant 115 lm/W as suggested in the ISO 52010-1:2017 standard. Making use of an empirical luminance efficacy model will result in this relationship to vary in the range of roughly 105-125 lm/W.
Hi @mrbro. There seems to be a dew_point_from_db_rh python script as well, maybe you can use that get the dew point from relative humidity and dry bulb temperature.
The epw files do contain the dew point temperature and information about location and leap year, maybe you can read that instead of the csv file.
You can delete 29th of February in the csv file if there is no way to specify that 2019 is a leap year.
I looked into implementing the Luminous Efficacy model, but there was some disagreement between the estimate_illuminance_from_irradiance python code, the orginal Perez article and the ISO 52010 standard so it will require more effort than I first imagened so not sure I’ll have the time for it anytime soon.
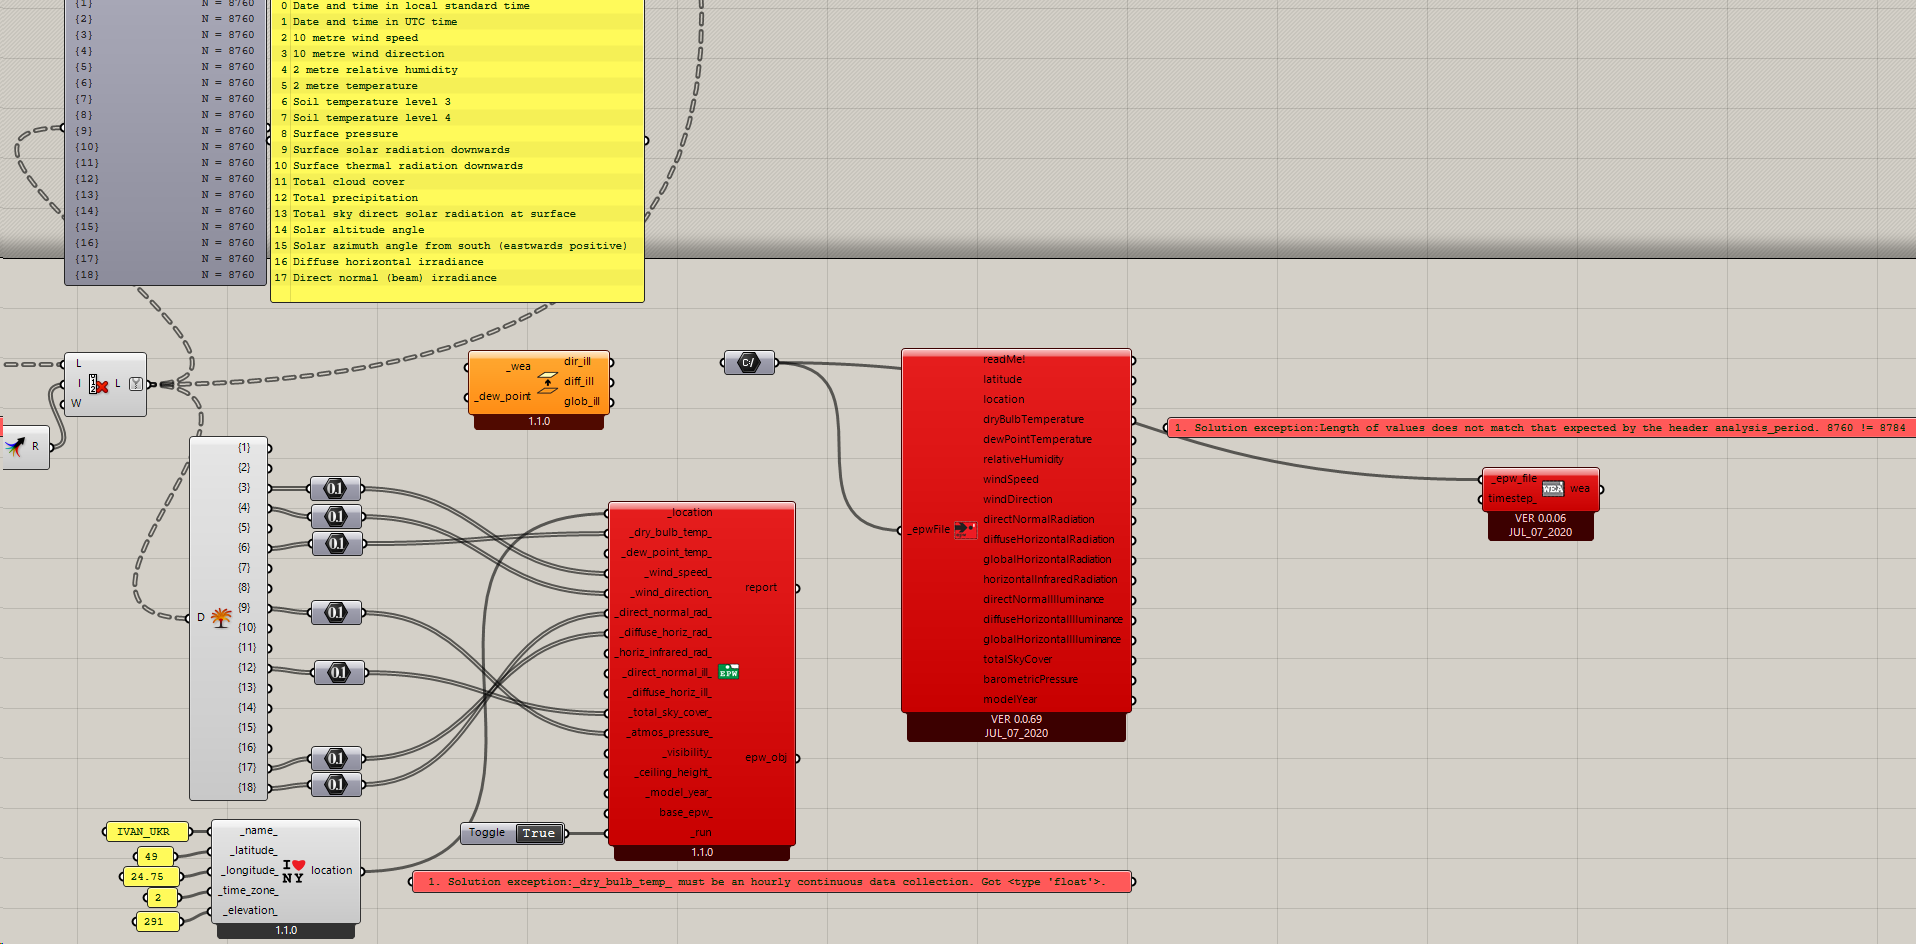
EPW weather files for leap years are supposed to have a value set to “Yes” in the header of the EPW. You probably have it set to “No”. You can see that the ladybug code parses this leap year value here:
If you set that to “Yes” you should be able to import it to Ladybug fine.
FYI, the reason that the “DF Create EPW” isn’t working is that you need to create DataCollections and not just plug in the values.
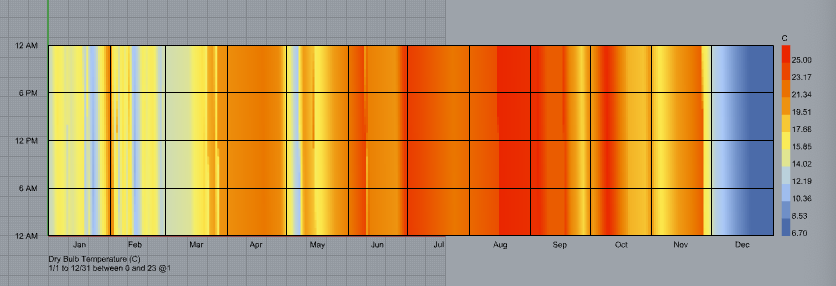
I am getting some odd results with the ImportNOAA component.
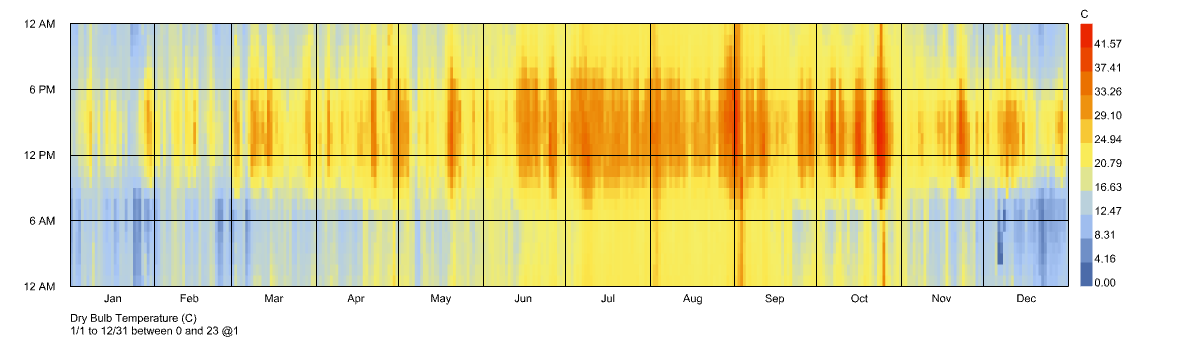
For air temperature, it looks like the daily value is more or less constant rather than displaying the expected diurnal variation.
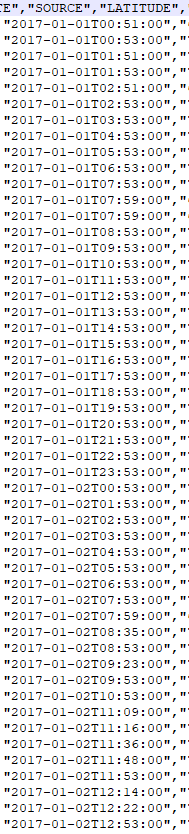
Strangely, this happens for all hourly data sets that i download from the NOAA site, but not for the Paris .csv file that is included with LBT 1.2. So my guess is that the issue is with the csv files. I check them, and they do include some periods with more that one observation per hour, but my understanding is that the component filters these out so it grabs only one observation per hour. Initially i though it was a leap year issue, but the error occurs for non leap year years as well. For leap years, i get the added error of “Solution exception:Length of values does not match that expected by the header analysis_period. 8760 != 8784”
Two NOAA .csv downloads are attached, one is 2020 data, the other is 2017. Really curious what is going on here! Thanks!
Hi, I have the same question since I create the epw file with Meteonorm. Maybe you can check the data with Excel for the superfluous data and modify your epw file. Or you can export it again by doing which I got my job done.
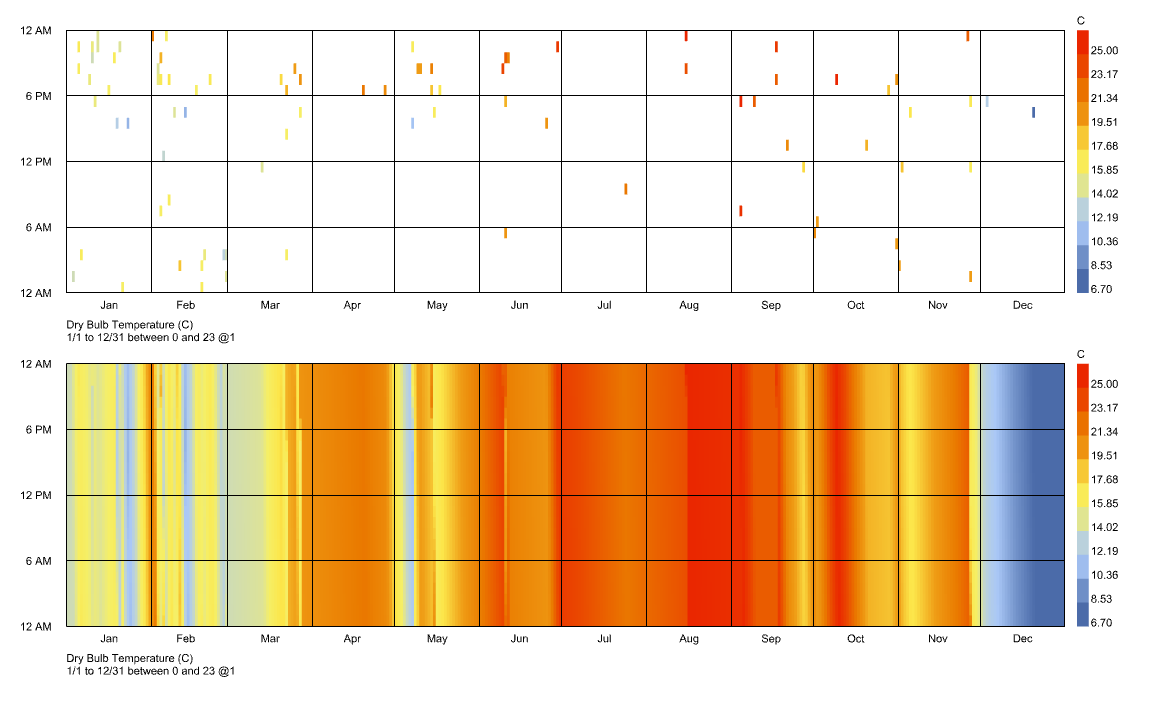
Oftentimes the data NOAA distributes from the NCDC does not include many data points that fall exactly on the hour. You can see the data points between which you are interpolating by looking at the hourly plots in the sample file:
So you’re trying to construct an hourly profile of temperature data using only ~30 hours.
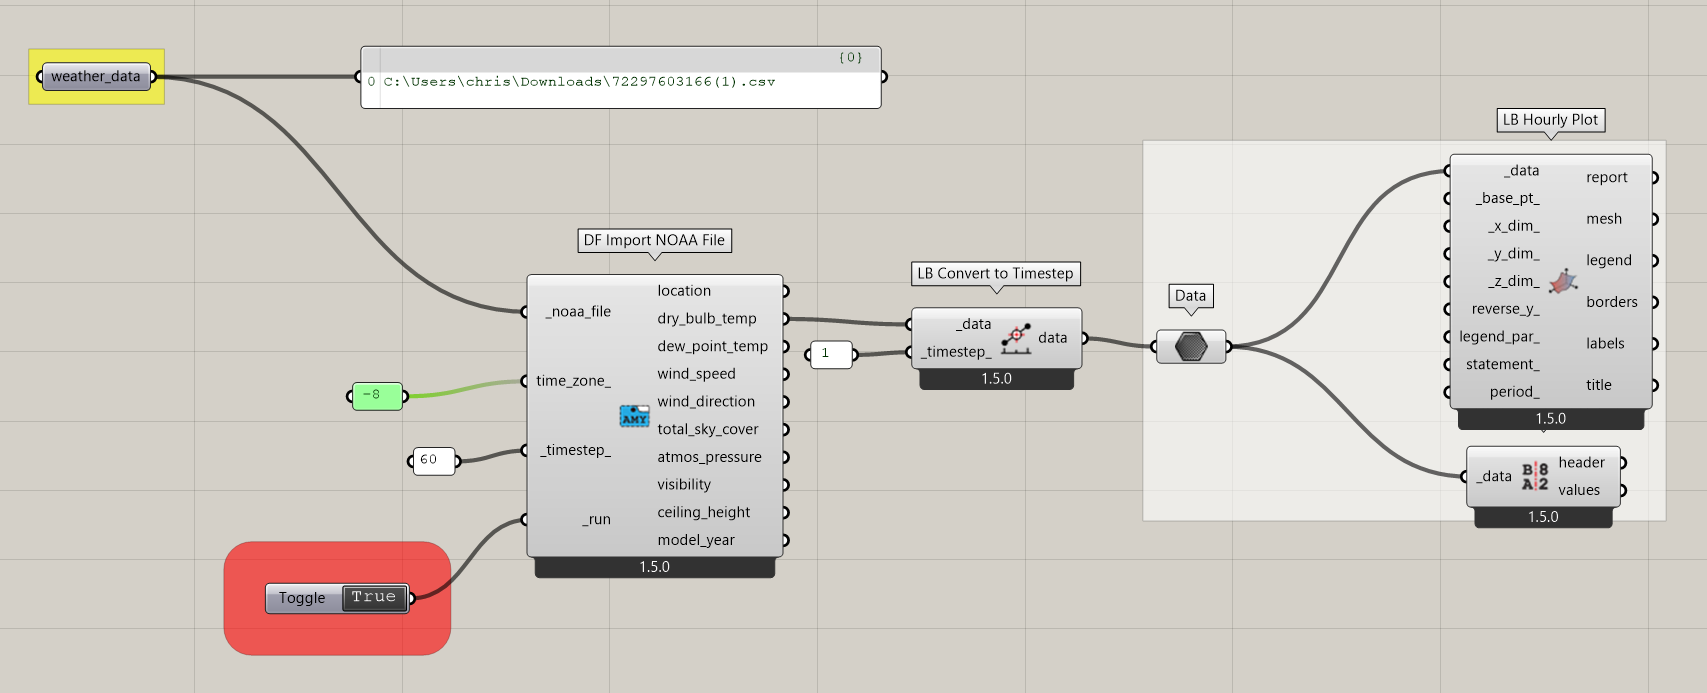
If you want to construct an EPW file using all of the data in the CSV, then you may need to import the data from the CSV with a timestep of 60. Then, when you use the LB Convert To Timestep component, you convert the data back to an interpolated data collection at a timestep of 1 like so:
Note that it takes a while to import all of the data from the CSV when it is at a timestep of 60 so you’ll have to be patient opening this file: alternative_weather_CWM.gh (23.7 KB)
Thank you for the useful information.
I have xlsx file that contain measured meteorological data of a location called Adama in Eutopia per 15 minutes, The data includes precipitation, solar irradiation on horizontal surface, relative humidity, temperature, wind direction and wind speed. I need to generate a EPW file for simulating a building in OpenStudio. Would that be possible and what are the steps?
Thanks