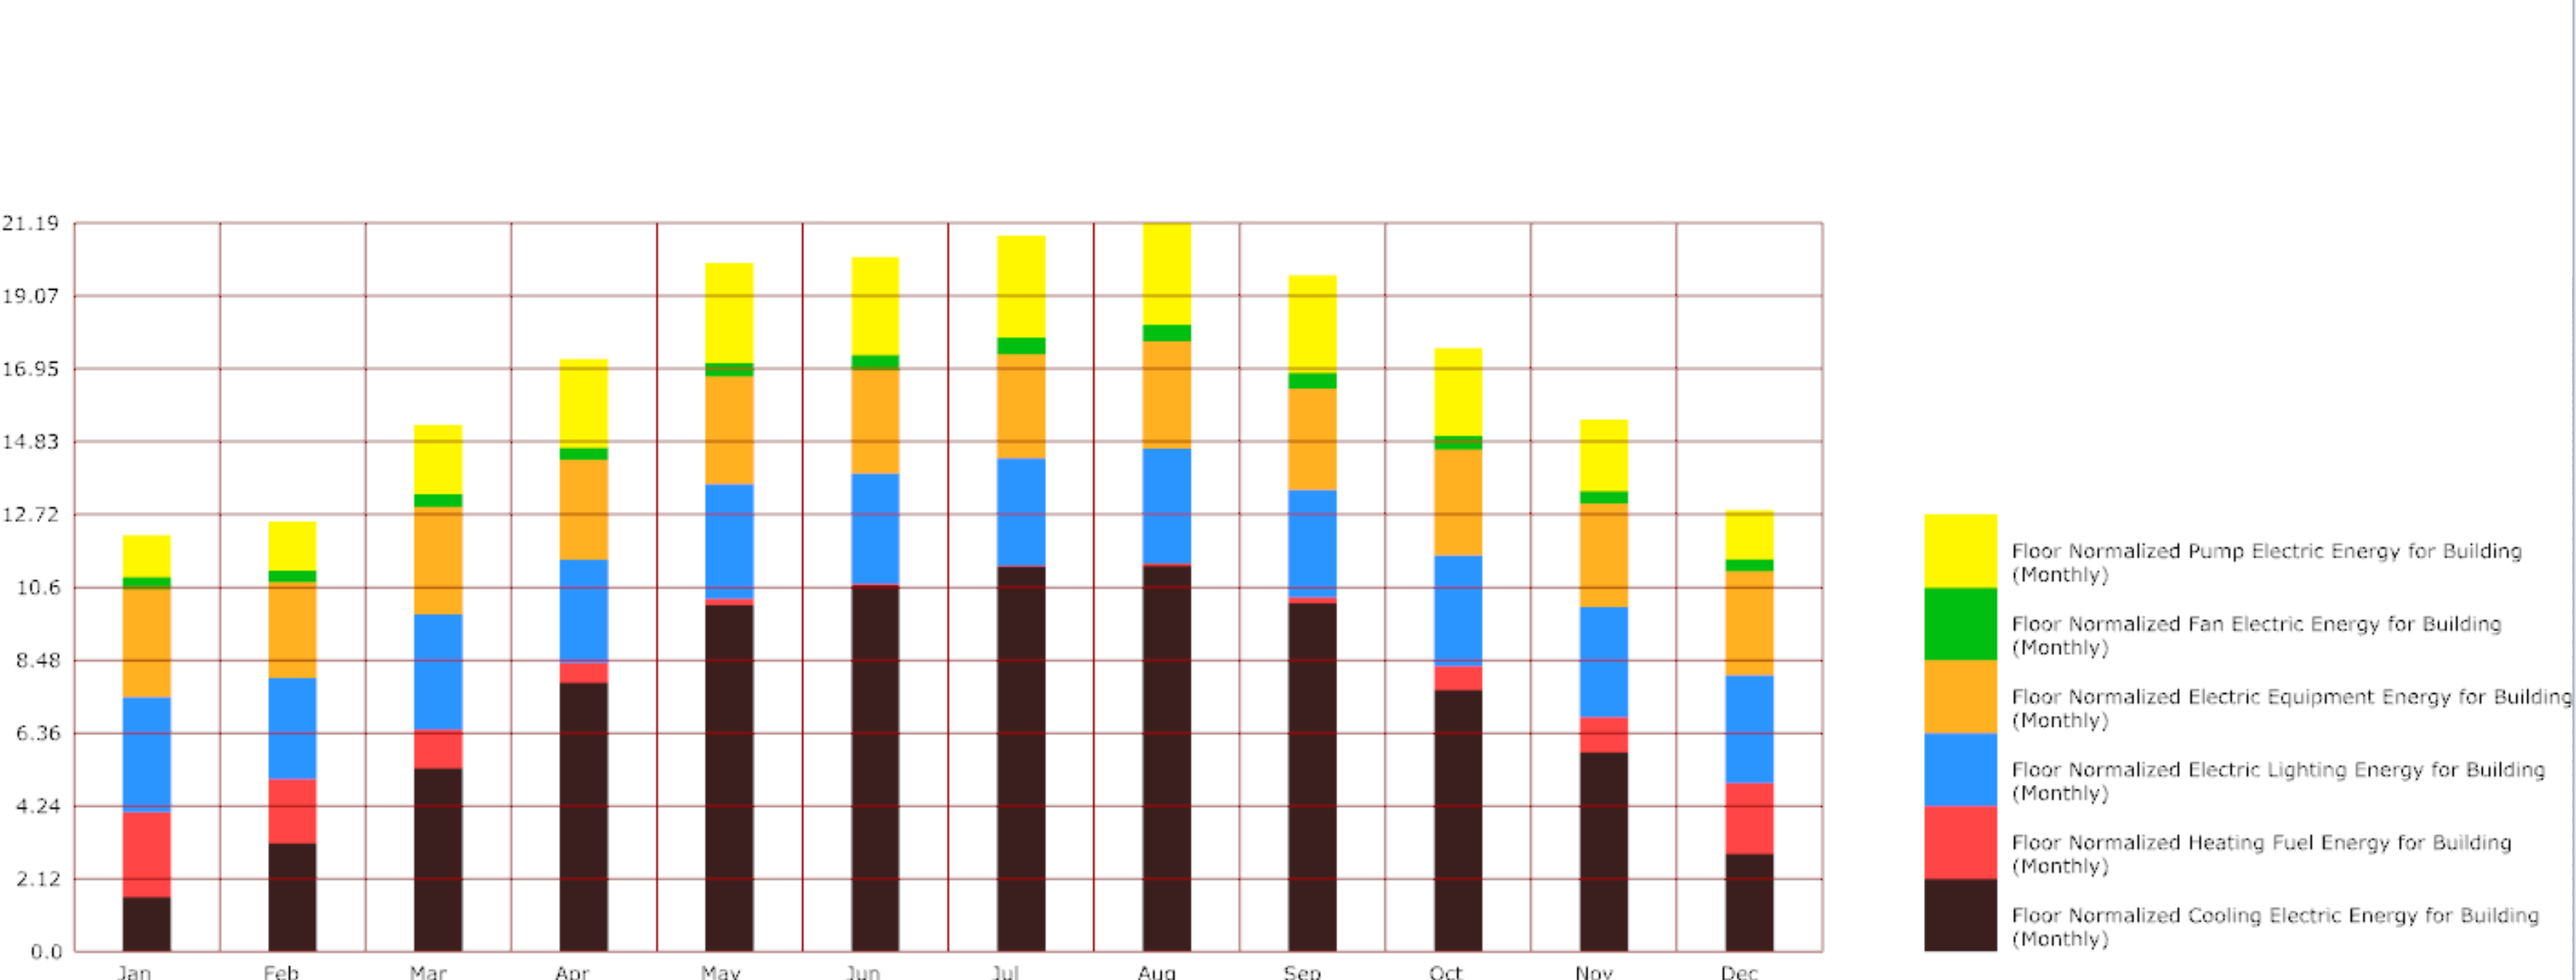
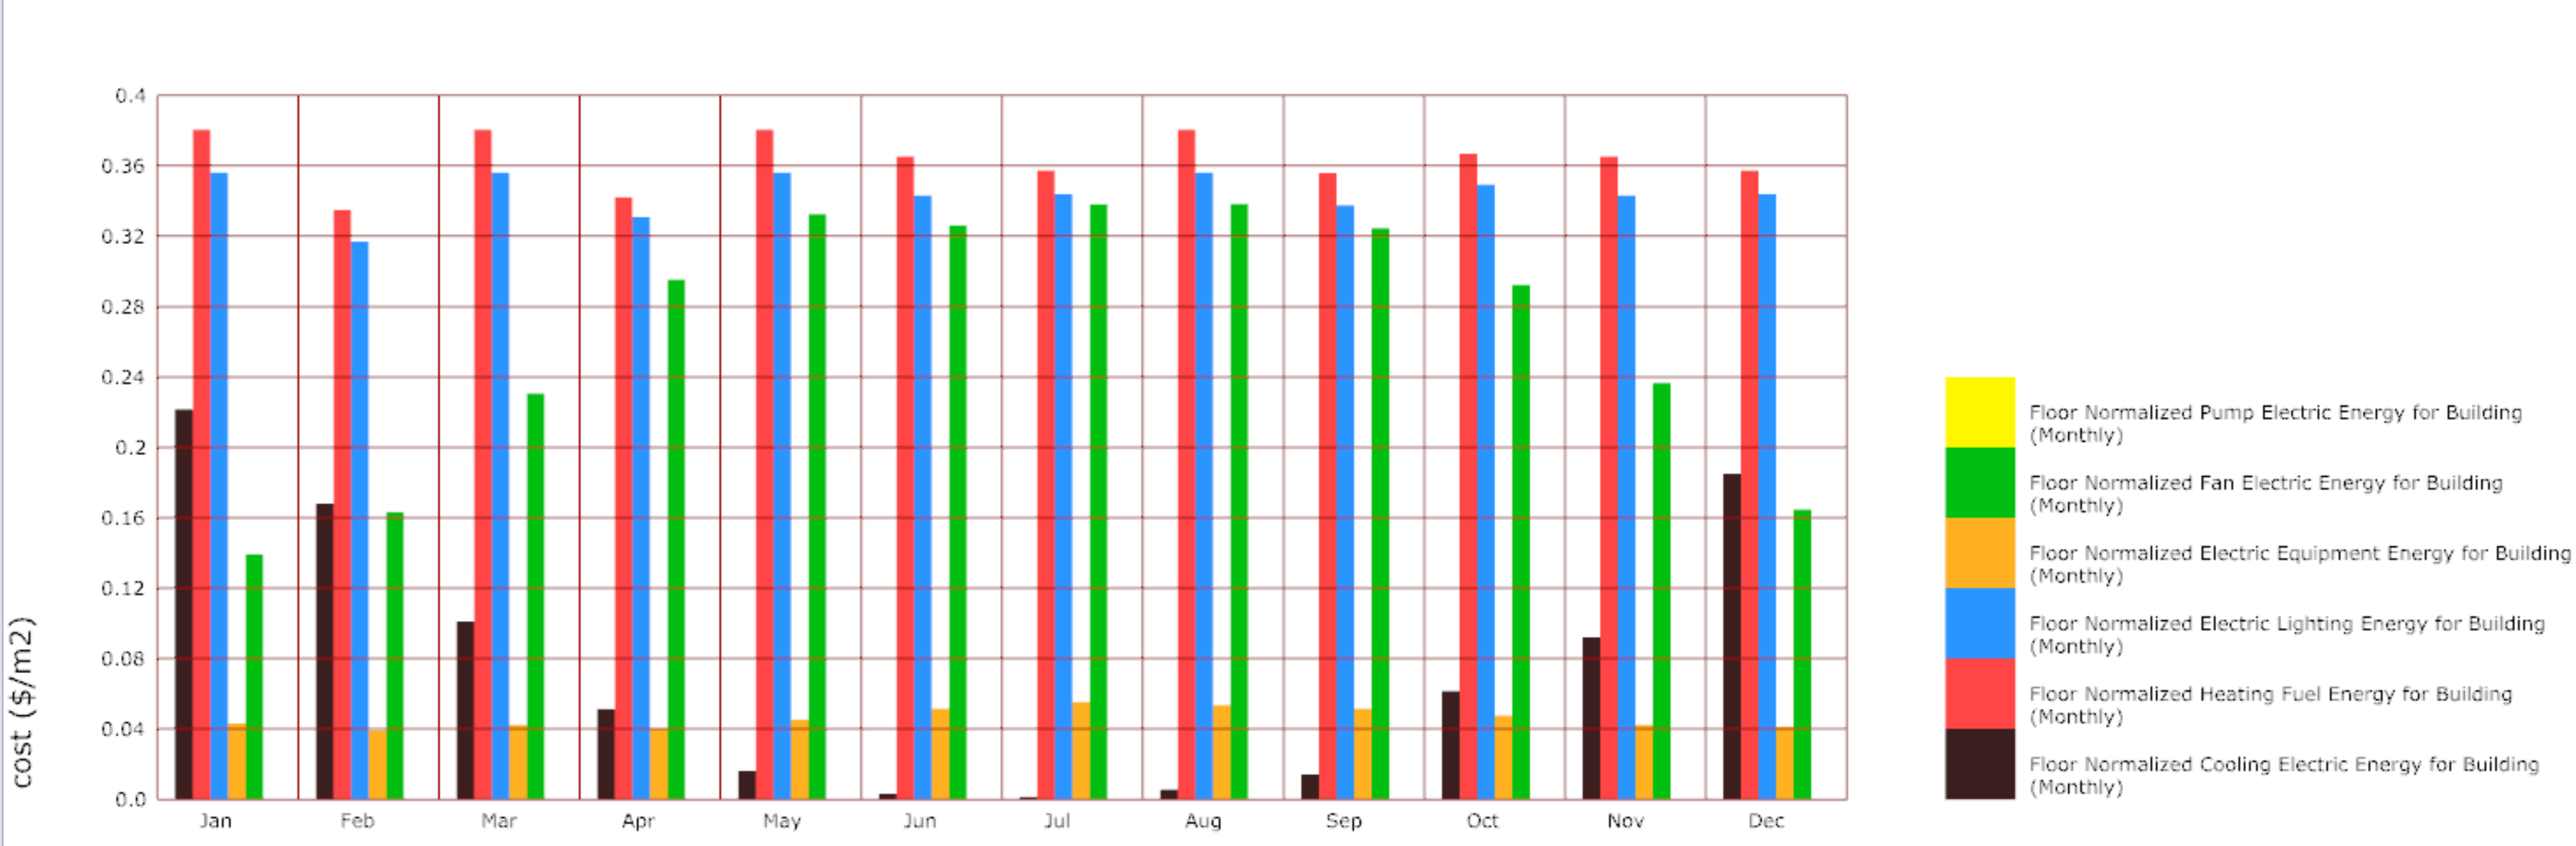
I’ve simulated a one zone open office floor in Houston, I created a monthly electricity usage graph (per square meter) the graph looks fine, then I created a detailed one that shows electricity cost/ square meter. This graph is odd, for example, the cooling cost in the winter months is unusually higher than in summer months. I have the feeling that it is a legend issue. I’ve attached the file, I grouped both graphs in blue color and I disabled the portions that are not needed for the purpose of the graphs creation, this way the file won’t take long to run. Any idea where the problem is? any help would be appreciated. U_1_zone_FCU_Ladybug_Dis_rev1.gh (1.8 MB)