I am new to Grasshopper, Ladybug and other modules but within several days that I spent on this environment I have not found the answer for one thing:
Can anybody tell me whether is there a possibility to, well… calculate and record results of calculations in a form of any kind of report that can be pulled/exported form Grasshopper (not into Revit/others but as a table or pdf) and other bugs?
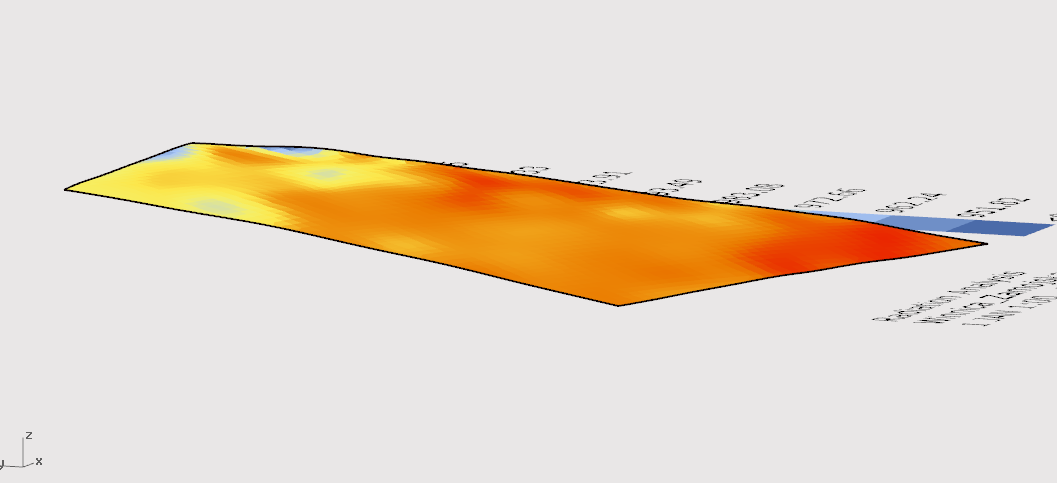
Let me to show it on example. Thanks to @devang I was finally able to obtain some results for radiation analysis. Values are correct and properly displayed on a imported geometry:
But then I had a second thought: how I can not only obtain coloured structure but also determine what is the total amount of energy captured by the surface, how big part of its area (let’s call it X) receives x kWh/m2? And - find out the same for the other values of the graph - what place in the energy distribution for this area it has?
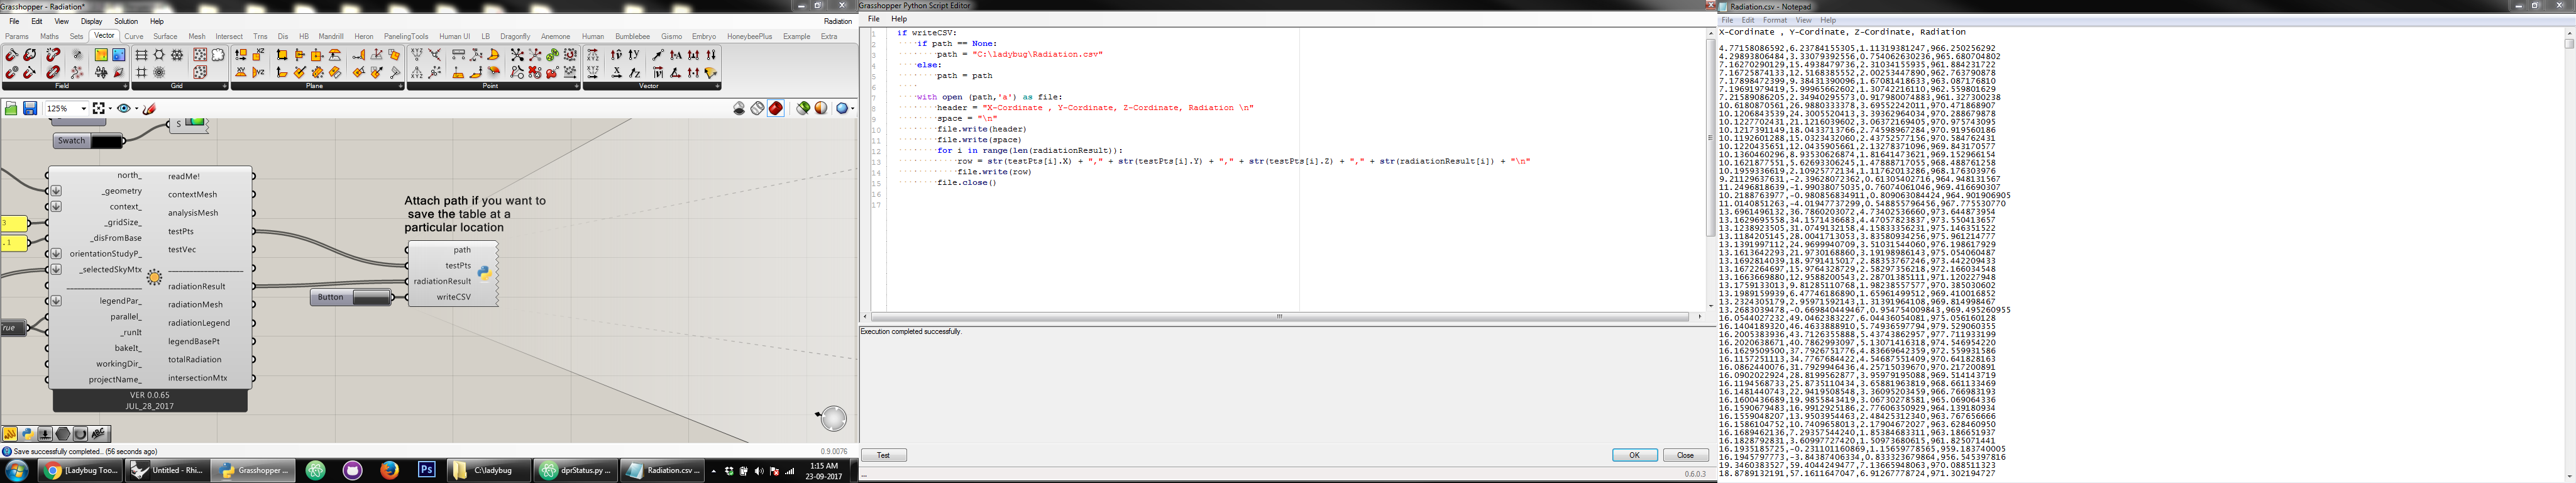
Possibly there is such solution, but I have not reached it yet. Can somebody give me a hint whether there is such way or not. And if yes - what I need to do to export it?
EDIT: just came to my mind - since the area is georeferenced and I like GIS approach, can the results be exported as a shp or kml files?
This has been discussed before. What @devang suggested should address your problem. The elegant way is to add the values to the mesh so when it’s baked one can retrieve the results. There is an open issue for this from 2014!
Thanks @mostapha - this is going to be good lecture and excercise for a coming weekend
With regards to fact how long this is an outstanding point - is this a some kind technology limitation that this solution (nothing automatic like “pick report type and bake”) did not found resolution? Just asking as I do not know the whole background…
@devang - Thanks a lot for the hint. Now properunderstanding of this a bit exceeds capabilities of a mind tired with a exhausting week but will return to this on Monday.
The only questions that come to my mind right now is how I can check few things:
Size of the geometry - I know the real dimensions of the given plot but I’d like to double check it (I know, this annoying but I was thought to always question the assumptions and facts )
Size of a point for which the result was calculated - the energy was calculated in kWh/sq m so I’d like to know how big the point is (i.e. whether it is an equivalent of a real square meter or something smaller/bigger).
Ok… it’s very late here time to go to bed and not dream about colourful charts @mostapha , @devang - have a great weekend!
There is no technical difficulties. Mesh has this build in and we should just implement it. It’s a matter of time and priorities. It has never been on top of the list and no one has picked it.
Now to answer your questions:
Check the analysis mesh output and you will have access to each mesh face, which you can use to calculate the area.
The value is kwh/m2 for each point * the are of the mesh face. The test point is located in the center of each mesh face and it represents the whole mesh face. The size of the mesh depends on your input for the grid size.