Hi
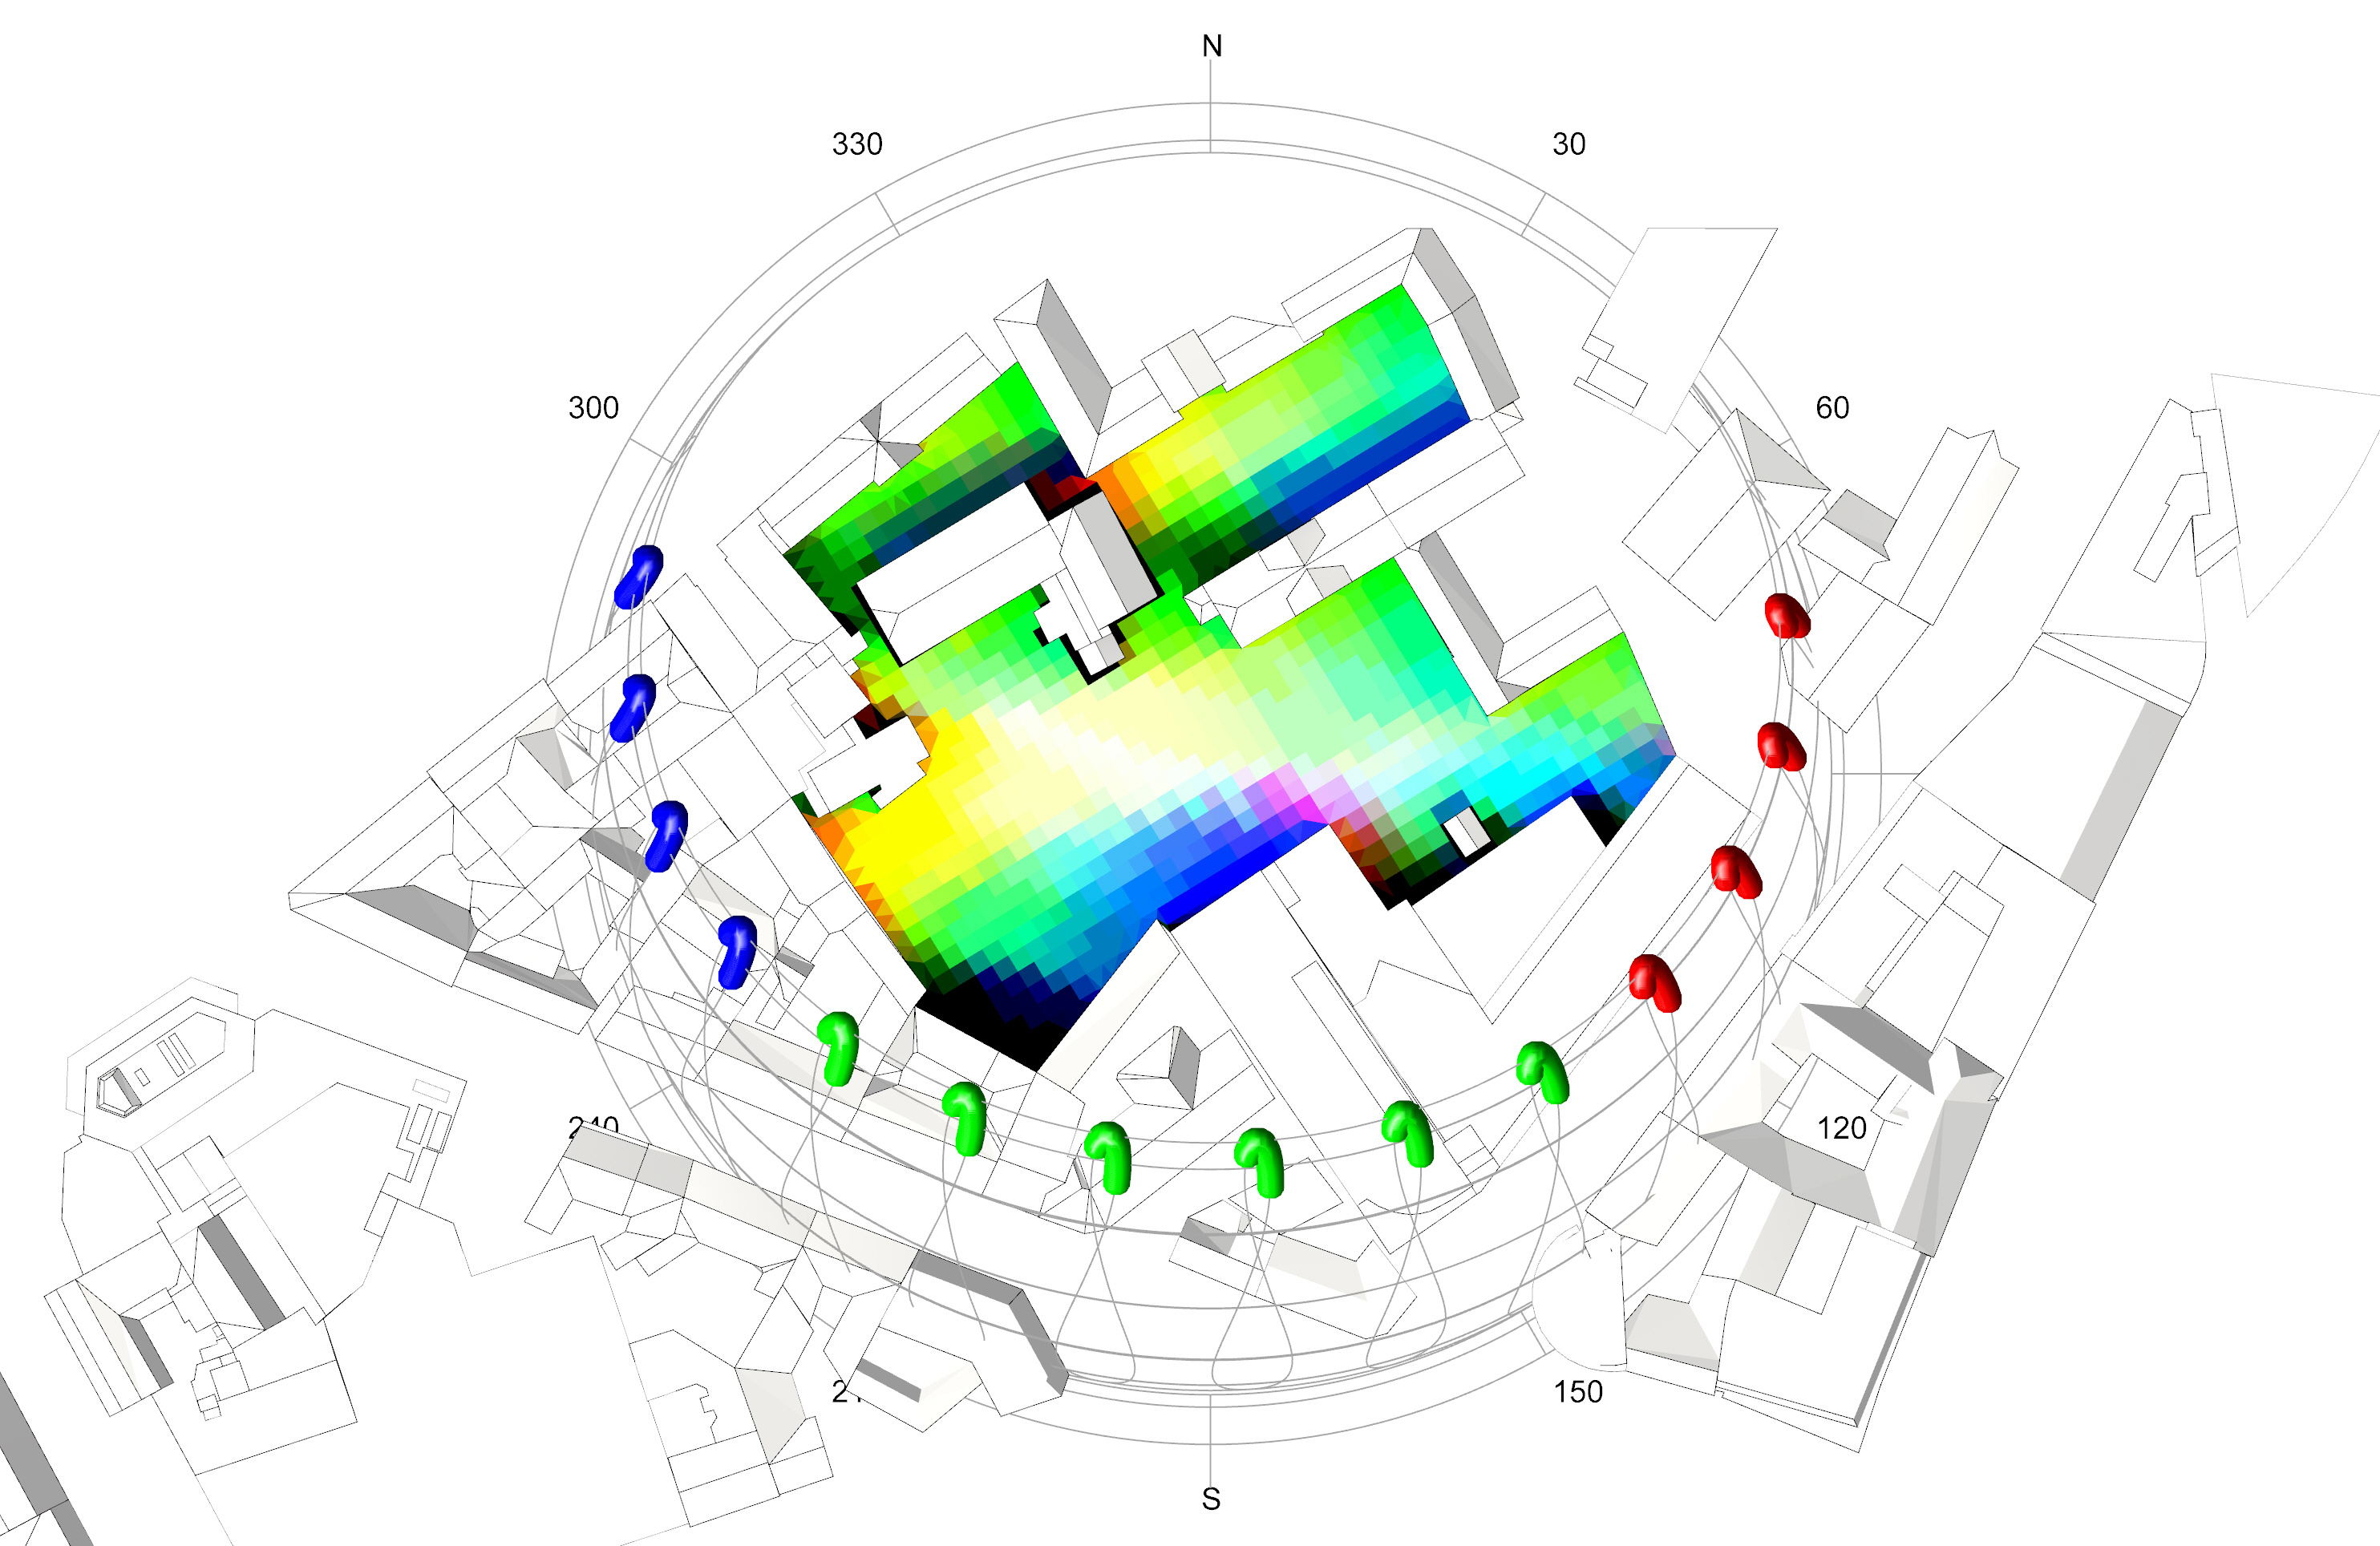
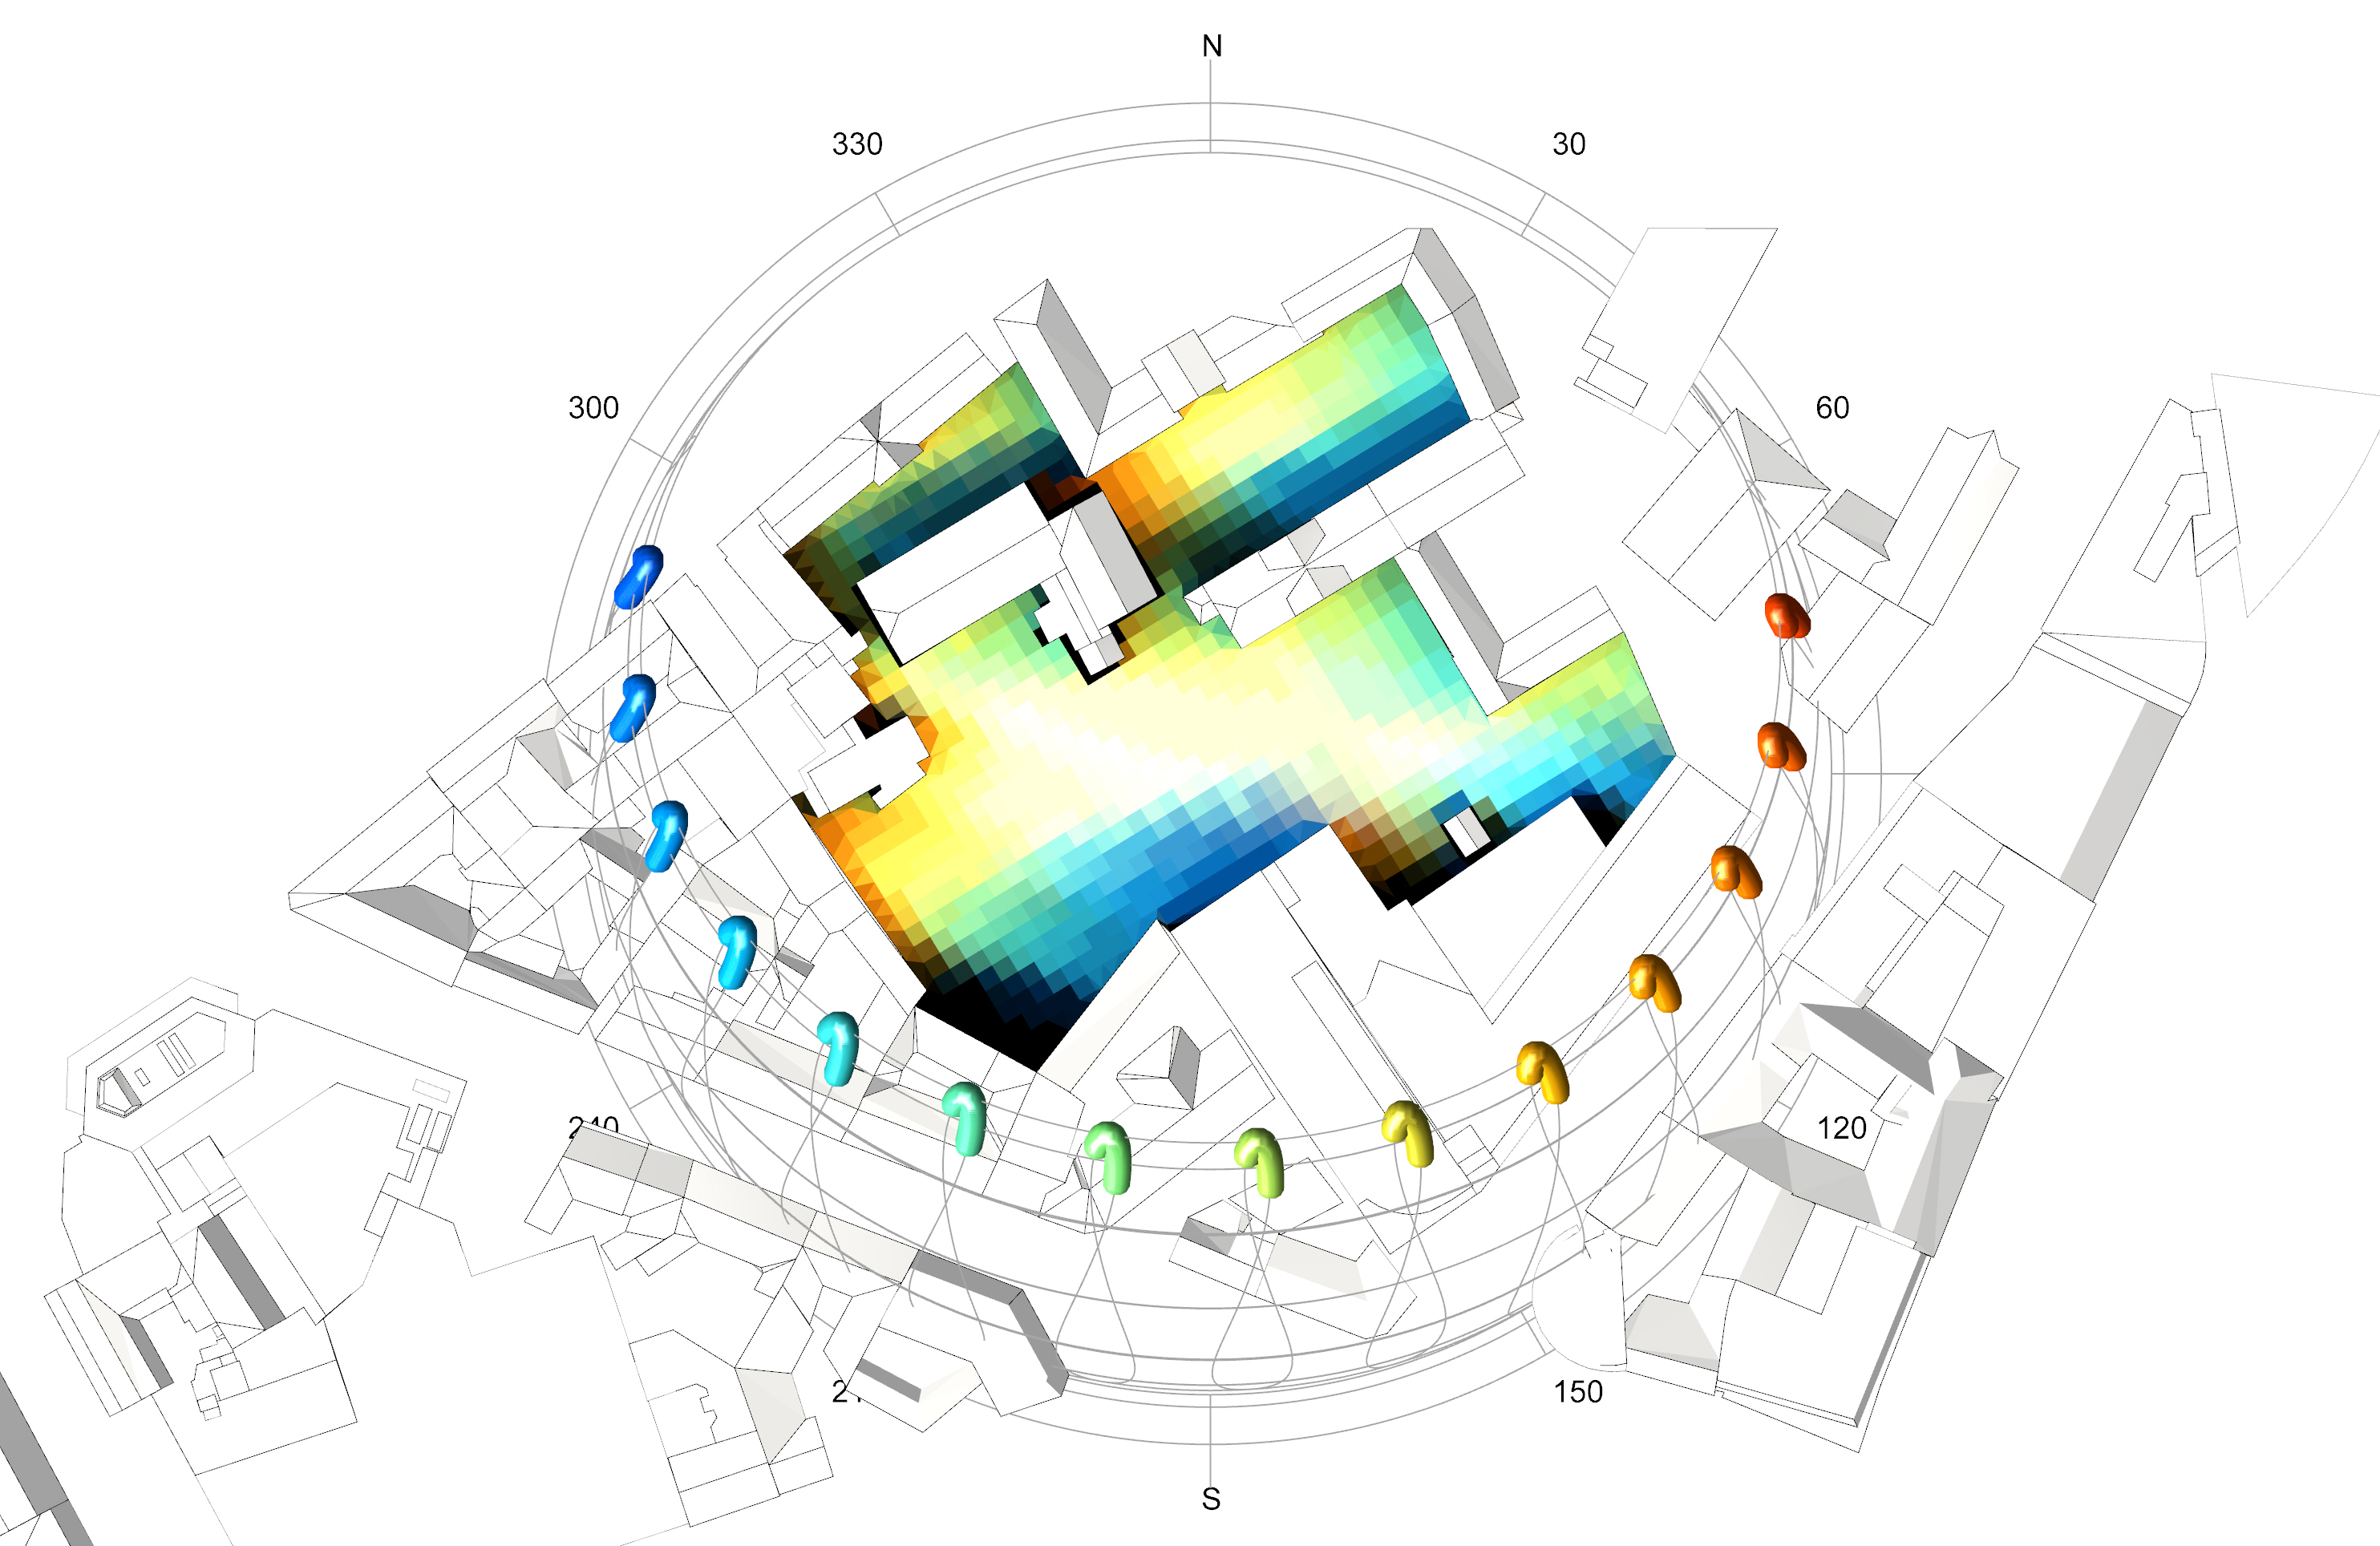
I thought I’d share an idea with the sunlight hours analysis component. By assigning different RGB colours to the hours of the day it’s possible to visualise not just the how many hours of sun which hits a surface, but also at what time during the day it’s illuminated. It could be a useful illustration to use in early sketches of a project, for example.
I chose red for the morning, green for the middle of the day and blue for the afternoon/evening. The colours mix, so an area with sun in the morning and late afternoon will have a purple colour. Areas without sun are black, and areas with sun all day are white because all the colours are mixed together. I made two variations on the idea, but I can only post one image since I’m a new user:
TH