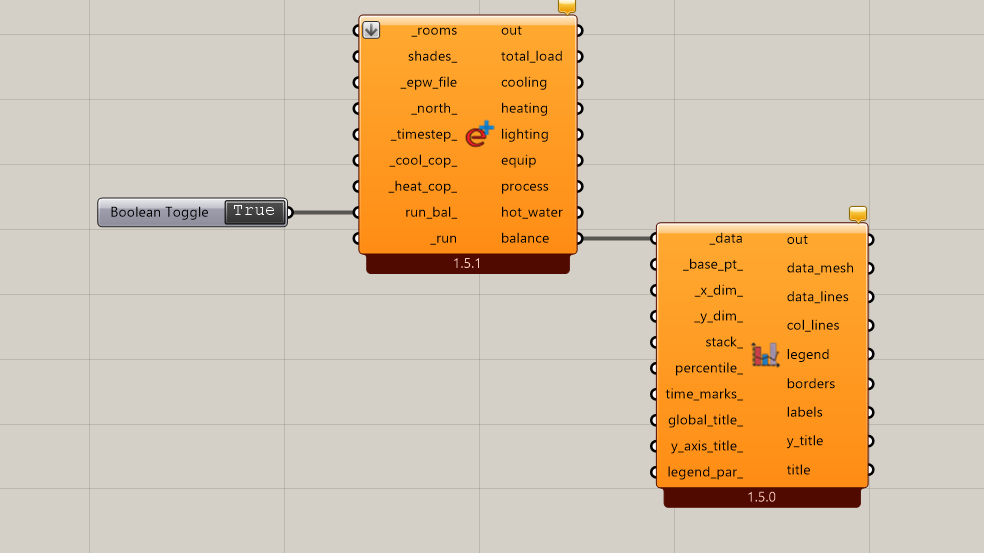
I want to calculate the annual loads and followed ‘Ladybug tools’ videos and honeybee energy script. I made schedules/ day profiles in detail and construction but they show exorbitant/ crazy energy levels and results, which is not possible. I tried both with energy plus and HB read room energy result. What is wrong here? (script attached) Energy according to facade fabric unsure.gh (177.4 KB)
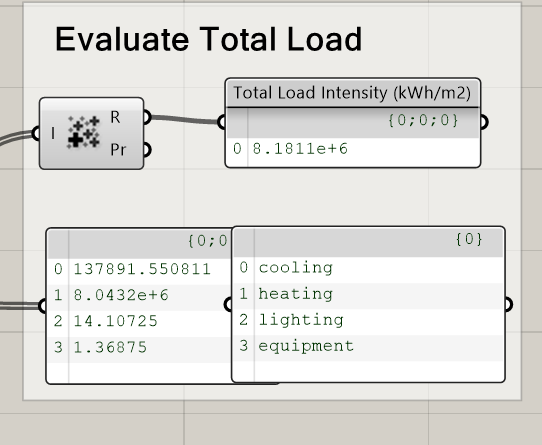
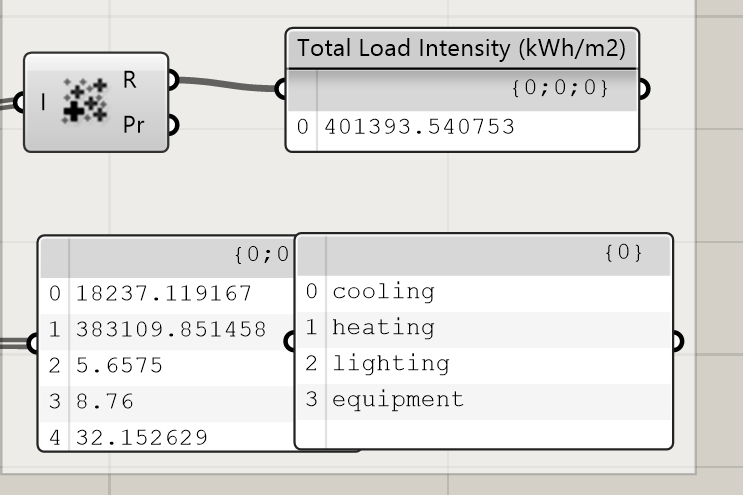
Hi @Erikbeeren, I changed the units too but as soon as I add schedule and profiles to the model, it shows crazy numbers too. Eg. cooling before was 33 kWh/m2 but now is 8720 which is not possible.
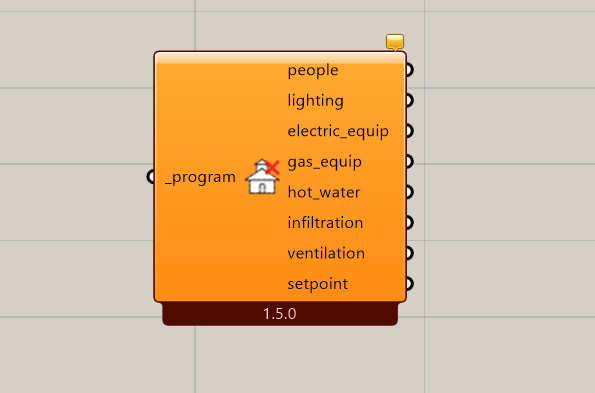
Yes my setpoint is 21 C for heating and 24 for cooling, but I don’t understand how that’ll cause a problem? Also I tried removing any setpoints too but didn’t change anything. I’ve attached the script too
something wrong with the setpoints or the amount of the mechanical ventilation.
Ventilation is causing the problem. Infiltration looks also a bit high.
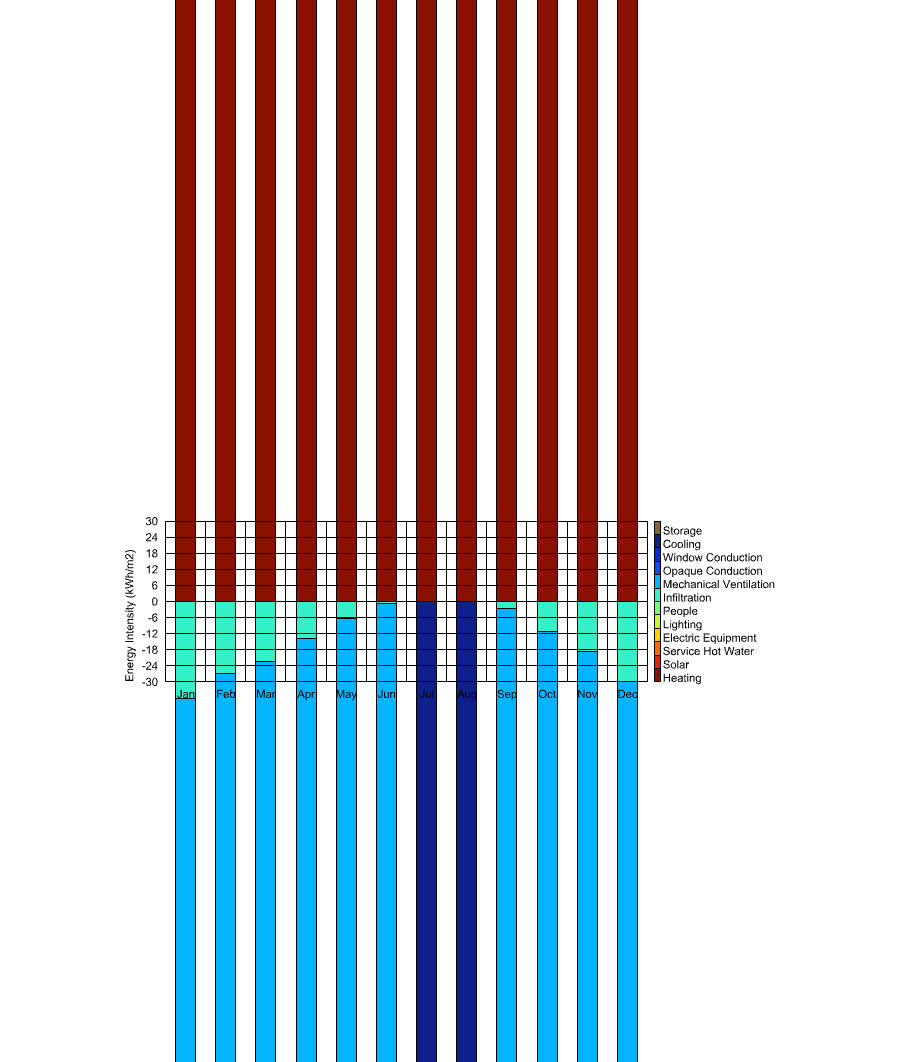
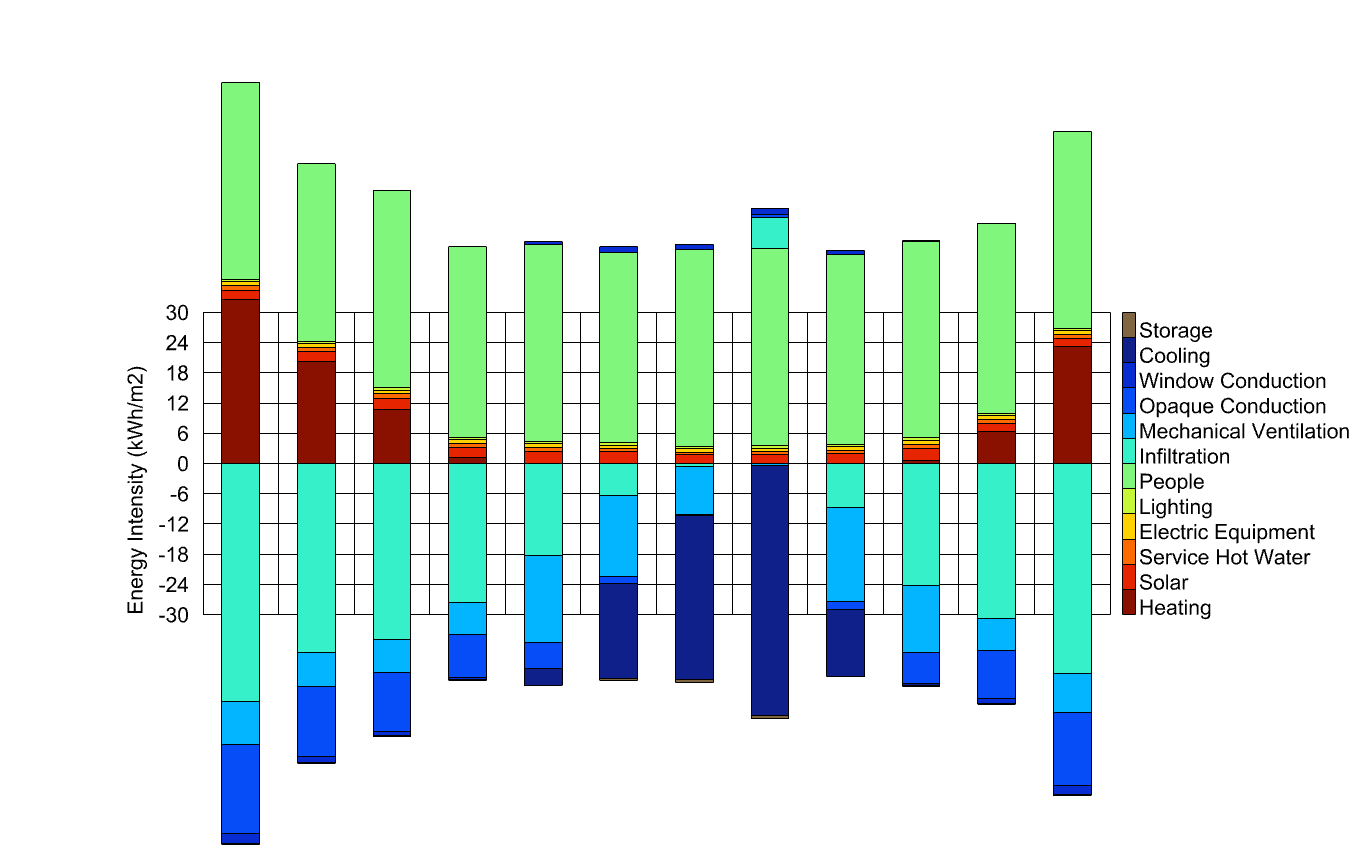
You can make an hourly plot of the ventilation to see what is happening.
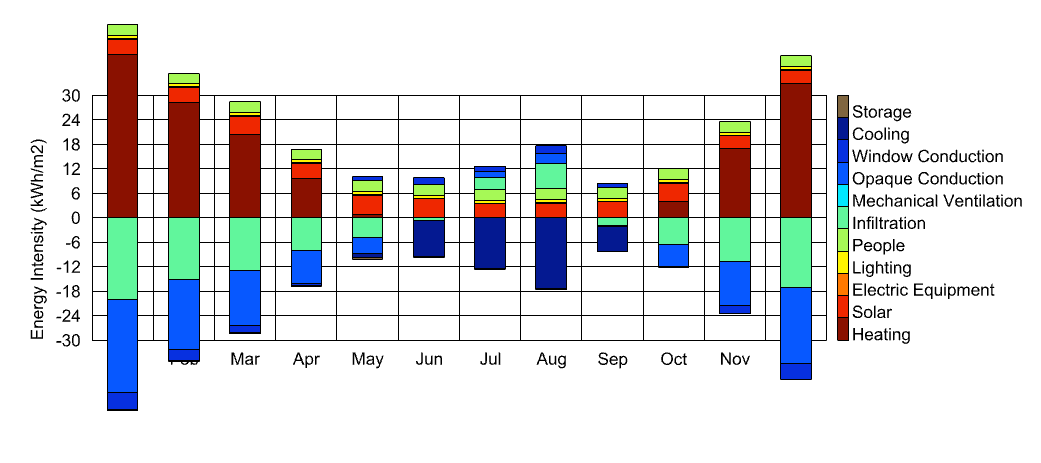
You are right, I removed the ventilation and now it’s reasonable. But it’s a building in Seoul I’m testing and still it shows more cooling than heating? With low shgc for glass shouldn’t it not be the case?
Also I haven’t added infiltration but not sure how it’s so high?
now lighting and infiltration are now the main reasons causing heating and cooling. Check thes setpoints and ask your self if these values are correct.
Set points are as I mentioned 21 C for heating and 24 for cooling (not for residence), but I haven’t added any infiltration. It should then assume 0 right?