Hello,
I want to get a comfort graph from the adaptive comfort calculator but I want to show results only for the occupied time (7:30 am to 6:30 pm monday to friday) I’ve been trying with the analysis period component and with the schedule without luck.
Does anyone have an idea of how I can do that?
Thank you in advance
Arturo
It’s like plotting any other chart for a specific analysis period. You can use filter data based on analysis period before connecting it to 3D chart component. See this sample file.
Thank you very much @mostapha,
I was missing tthat one step before connecting to the graph.
Cheers.
Arturo
Hi @mostapha,
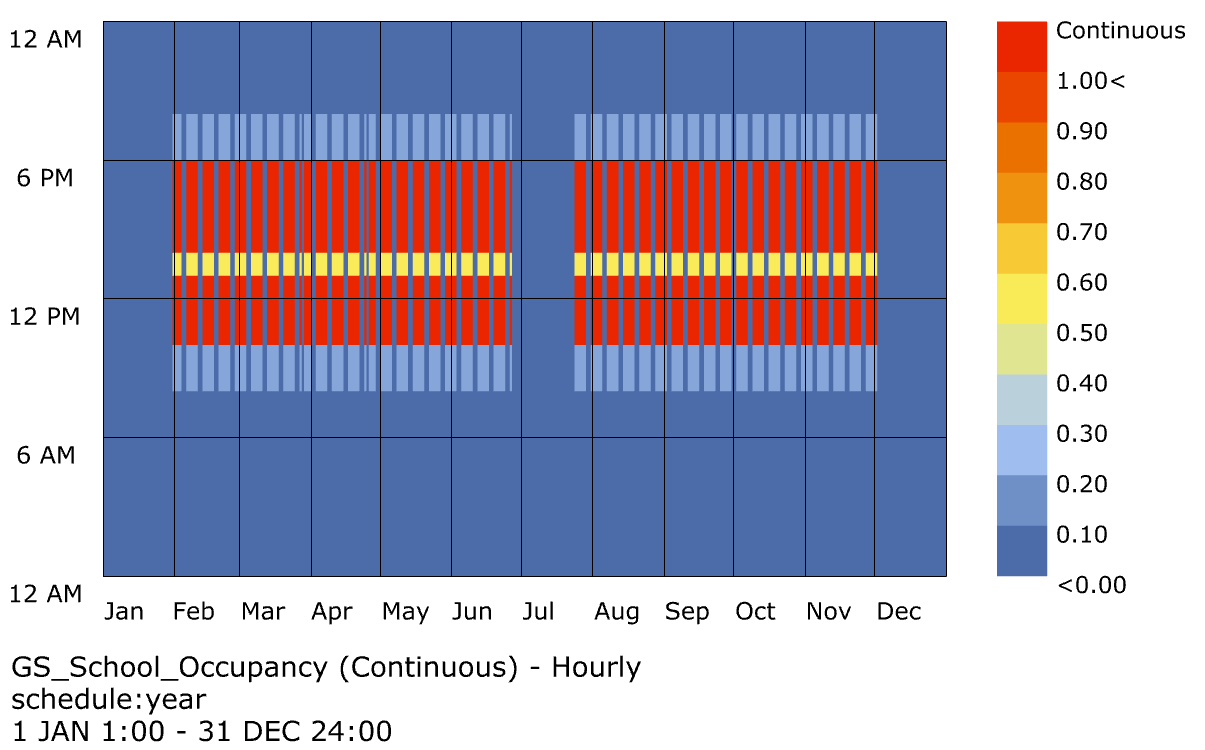
But how do you filter the results by the occupancy schedule? So it does not take into account holidays, weekends, and the hours outside of use that you don’t need to evaluate the thermal comfort.
I know that @chris already responded to the same issue but I couldn’t understand how to do it. (Adaptive Comfort Chart resulting hours)
Adaptive_Comfort_Chart - schedule filter.gh (897.0 KB)
Kind Regards,
2 Likes
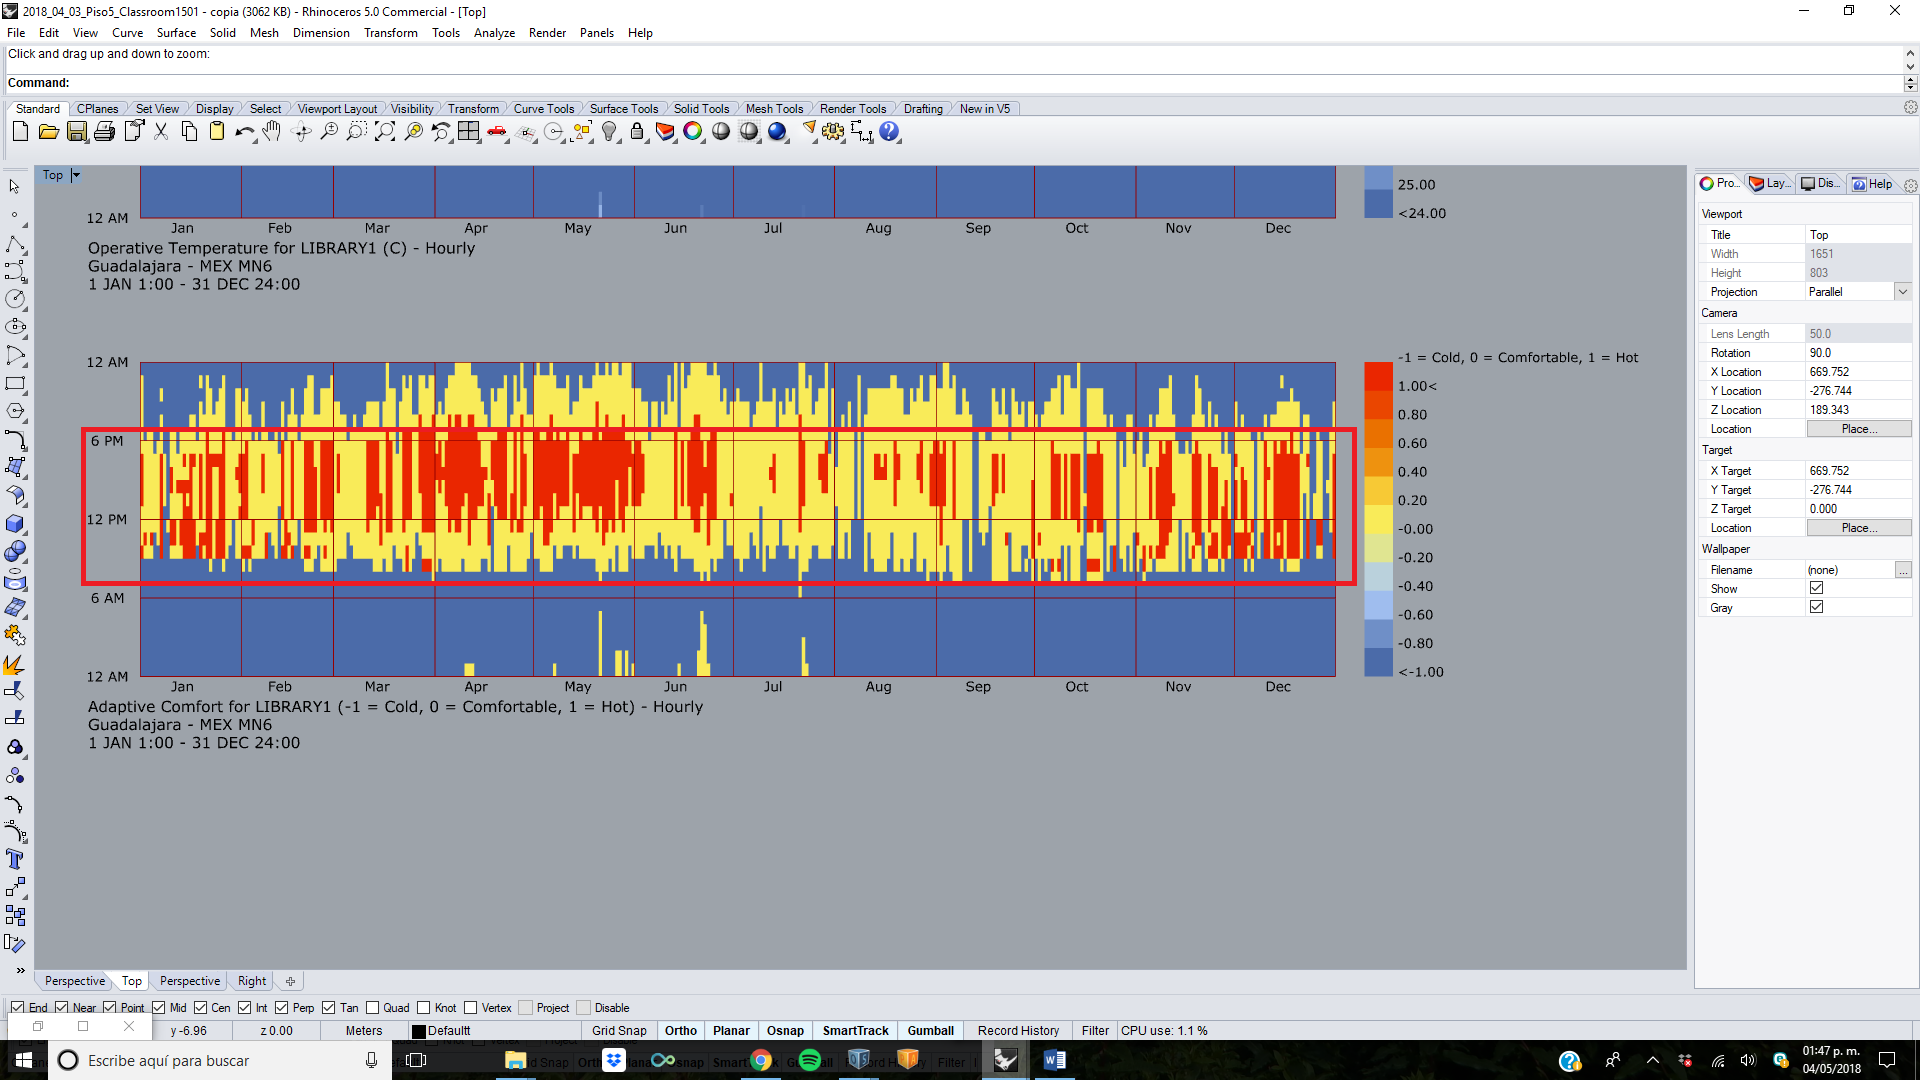
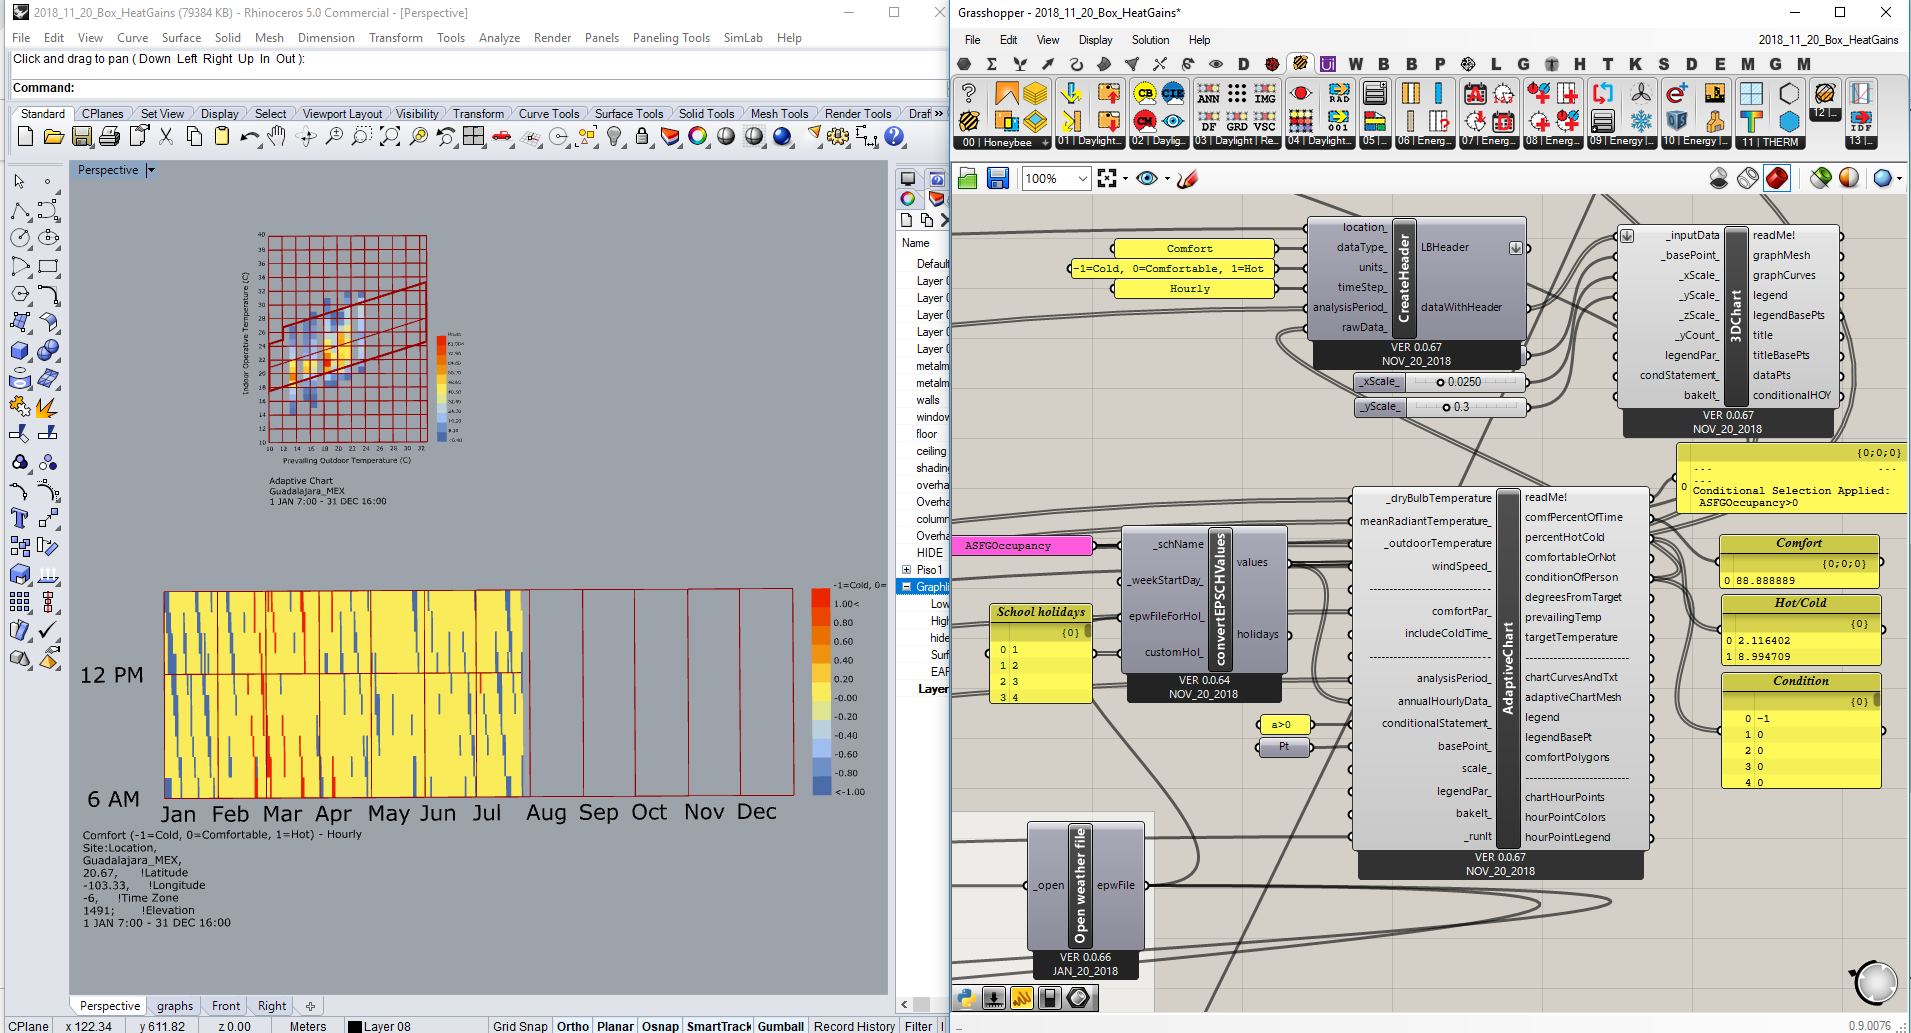
I went as far as defining the conditional statement and getting the correct results for occuppied periods, but I can´t figure out how to get a “yearly graph” keeping the correct dates attached to the results, since the conditional statement seems to delete the header and date data.
Best
Arturo