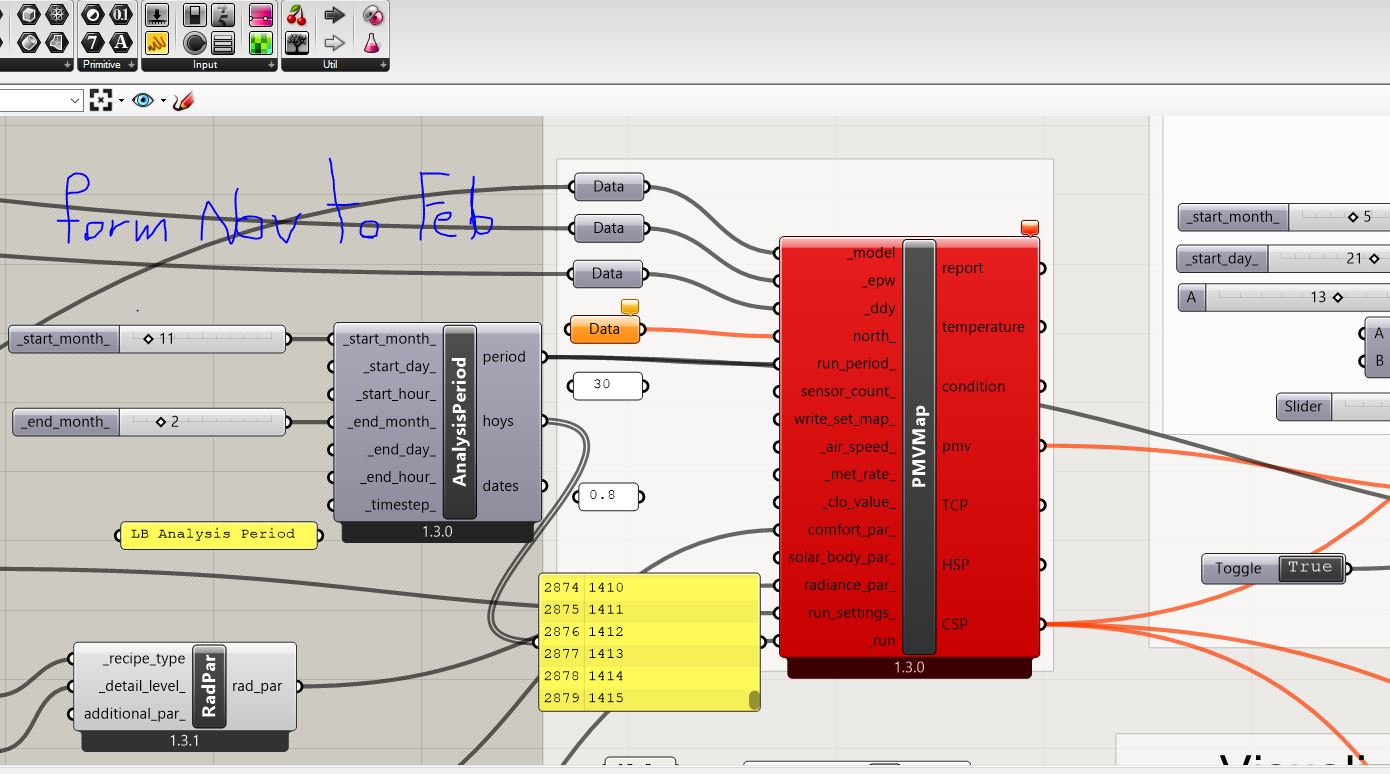
There is a problem with the cross-sectional simulation of the year (Thermal comfort). When the time interval is from the small number to the large number (for example, from the sixth month to the twelfth month), there is no problem and the simulation-run is done properly; But when this number is from large to small, this error is observed:
Solution exception:Run period start time must be before end time. “01 Nov 00:00” comes after “28 Feb 23:00”.
For example, I need to analysis from November to February; But there seems to be a problem. I found a post in the forum but there was no answer.
Thank you for your help.
The message is pretty clear. The comfort recipes can’t handle reversed analysis periods right now. I’ll hopefully add support for it in the future but, for now, you’ll need to run the full year and postprocess the results with your reversed analysis periods.
No, I do not mean long run time; also, the simulation speed is very good. I wanted a cross-sectional study for a specific purpose in my project, which is not yet possible.
I asked this question in general and I am very eager for version 1.4 to be released and more features available; Especially in the shadings and control them.
I look forward to seeing it in a few weeks. Thank you very much for your efforts.
You should be able to apply the analysis periods afterwards using the HB Read Thermal Matrix and the HB Visualize Thermal Map component. Just plug in the period_ to the “Visualize Thermal Map” component.
Still, I’ll see if I can implement this with the other changes that I’m making for LBT 1.4
I just pushed an updated set of comfort-mapping recipes to the development version of the plugin. There are a lot of improvements in the new version and one of them is the ability to use wintertime analysis periods. So, if you update to the development version with the LB Versioner, you should now be able to run your original simulation without issues.
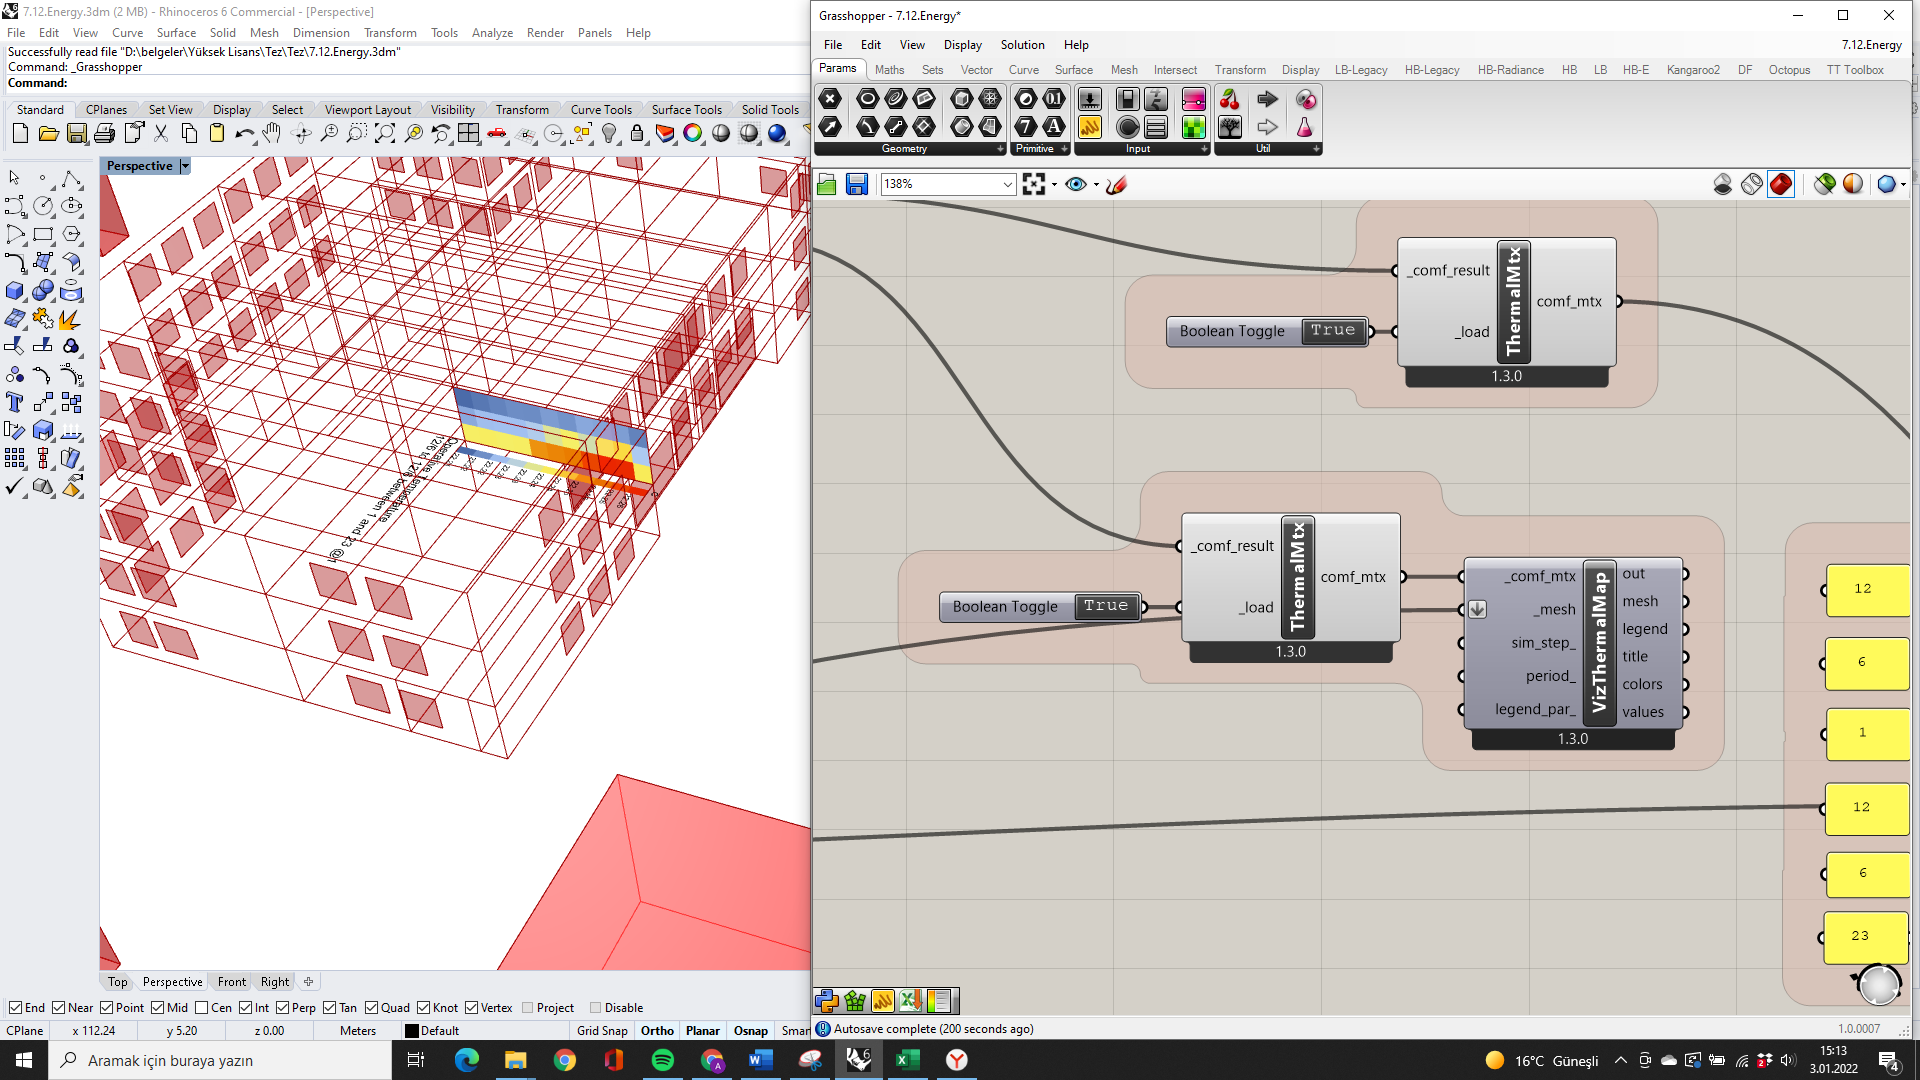
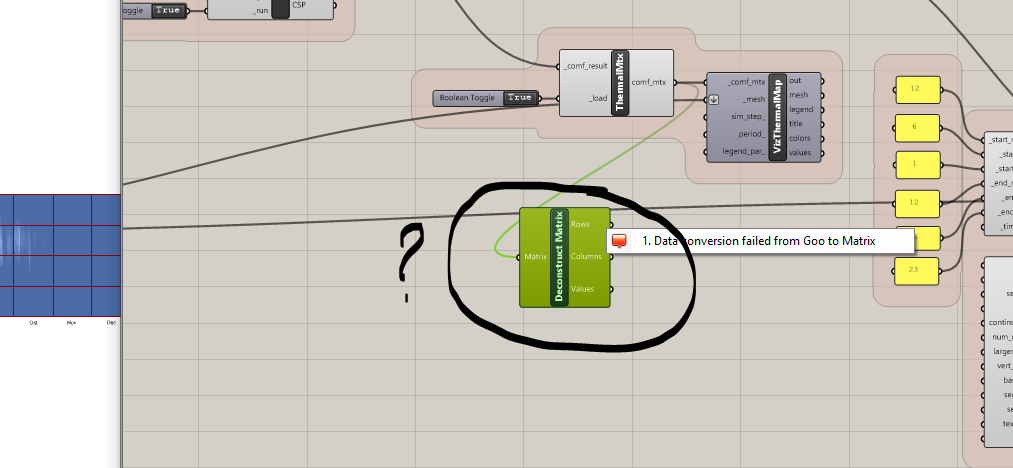
Hi, I also had the same period issue, and thank you Chris for your help. There is also another problem that I’m facing. In version 1.3.0, I cannot deconstruct the matrix of adaptive map and see the temperature values of all sensors hourly. Any solution regarding that?
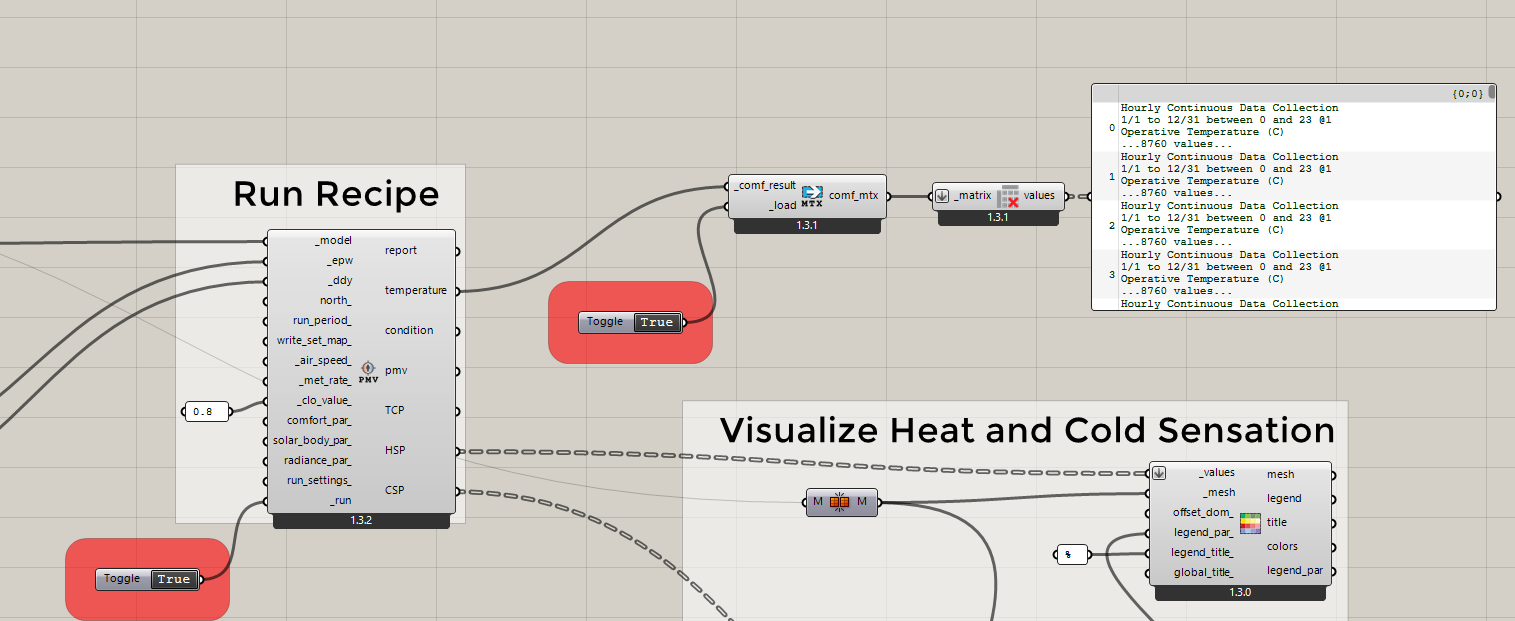
Deconstructing the matrix usually takes several minutes to run because it’s a lot of data that it’s dumping into the Grasshopper UI. How long did you wait for the component to finish running?
By the way, I’m able to get the visualized results and I can import them to Excel, the component perfectly works. I’m only not able to get the hourly results of each sensor