This is a simple request (I hope), but I haven’t been able to achieve it from efforts thus far.
Using the energy balance component, the default reporting output seems to be in a monthly bar chart. But is there a way to combine this data so that it reads as a single column for annual breakdown of the various loads?
Sorry for the incredibly late response. An energy balance over the whole year isn’t going to be nearly as helpful as on that is broken down my month since an annual bar chart doesn’t help you see what energy balance terms are offsetting (and therefore causing) the winter heating and summer cooling. This said, all of the Grasshopper components except the monthly bar chart will work the same whether the simulation data is monthly or annual. So just plug “annual” into the “Generate EP Output” component and you’ll be able to get the annual energy balance terms. You can take this data and make visualizations outside fo the ladybug components, or you can hack it with the Monthly bar chart component by replacing the values in the header with monthly ones.
Hello. To me, the annual balance is very useful for tropical locations. I tried to hack the monthly bar component… but I didn´t find the way, sonds easy but … help?!
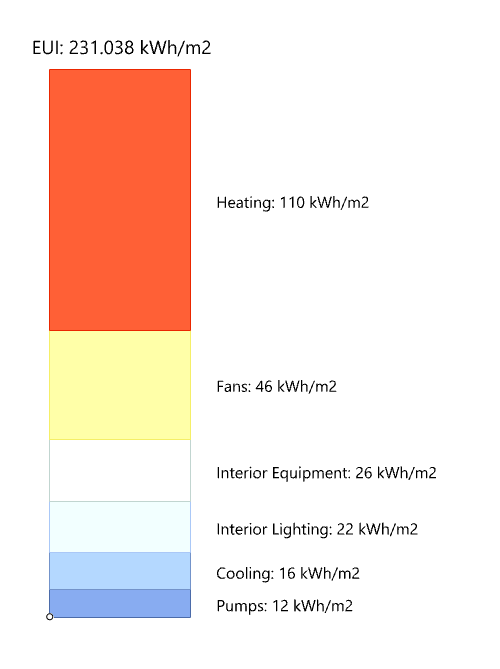
I managed cheat the LB stacked area chart to look like a bar chart by duplicating the data for annual values for EUI (it does not contain negative values). I guess it is a bit similar to what you are looking for?