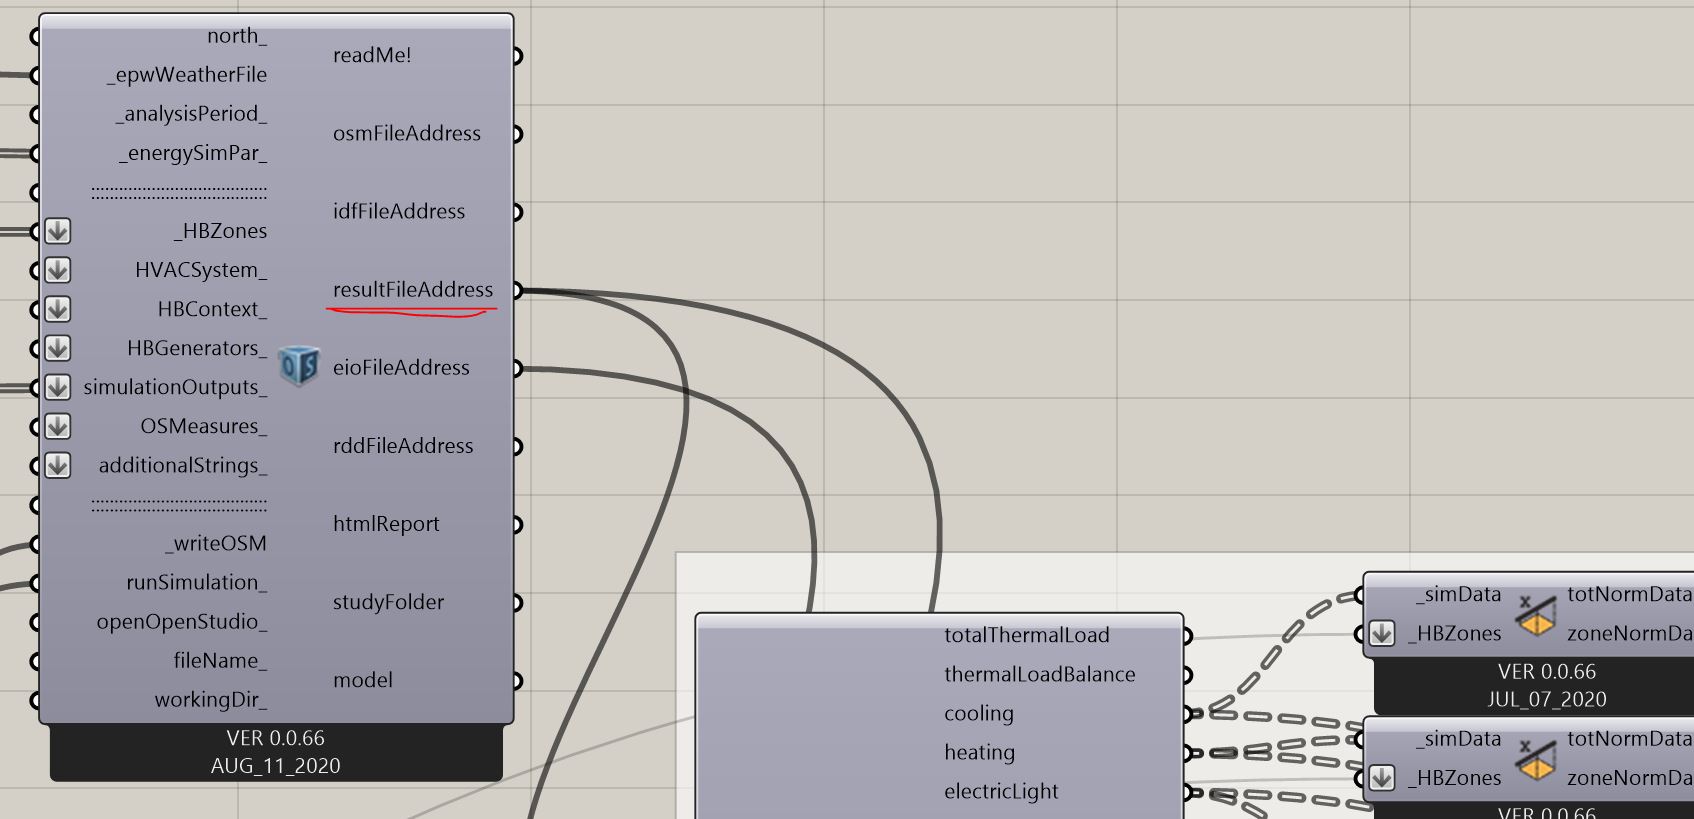
Thank you so much @wim for your response. I understand. Sorry I skipped that step. I have done that now and here is my file. Now my energy simulation works and the open studio issue is solved. But I still have the legend issue. And I also checked tolerance and unit in my rhino, I am in meter and my tolerance was 0.001 so I think that is fine. But I have no idea why my legend does not show up right.
For the component issue I will post in another topic. thanks.
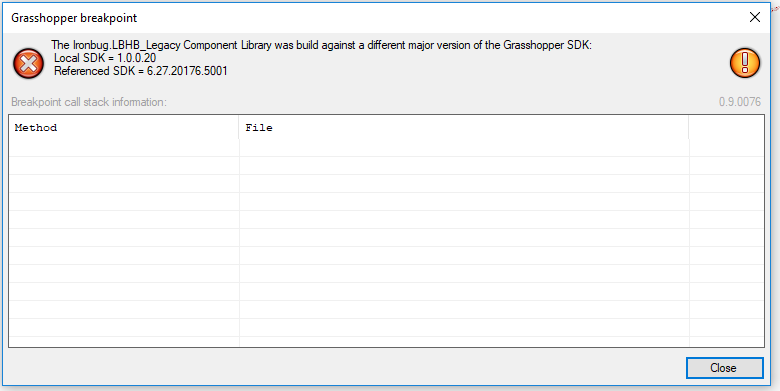
@devang Thanks for the response again. I tried in another rhino file and still the same issue. But I got this error now when I opened my grasshopper. Does that mean that my grasshopper version is not compatible with honeybee/ ladybug I have? Maybe I have to reinstall the grasshopper I have. I will try that now.
No harm in trying that. I am using rthino 6 with grasshopper version 1.0.0007.
The error you are showing is coming from Ironbug component which I don’t believe you are using in your grasshopper definition.
@devang Oh I see. I am using rhino 5. Does this have to do with my rhino version? Is that possible? Maybe it is not compatible with the new components. I do not know I mean that should not be the issue but I am just trying to understand what can be done.
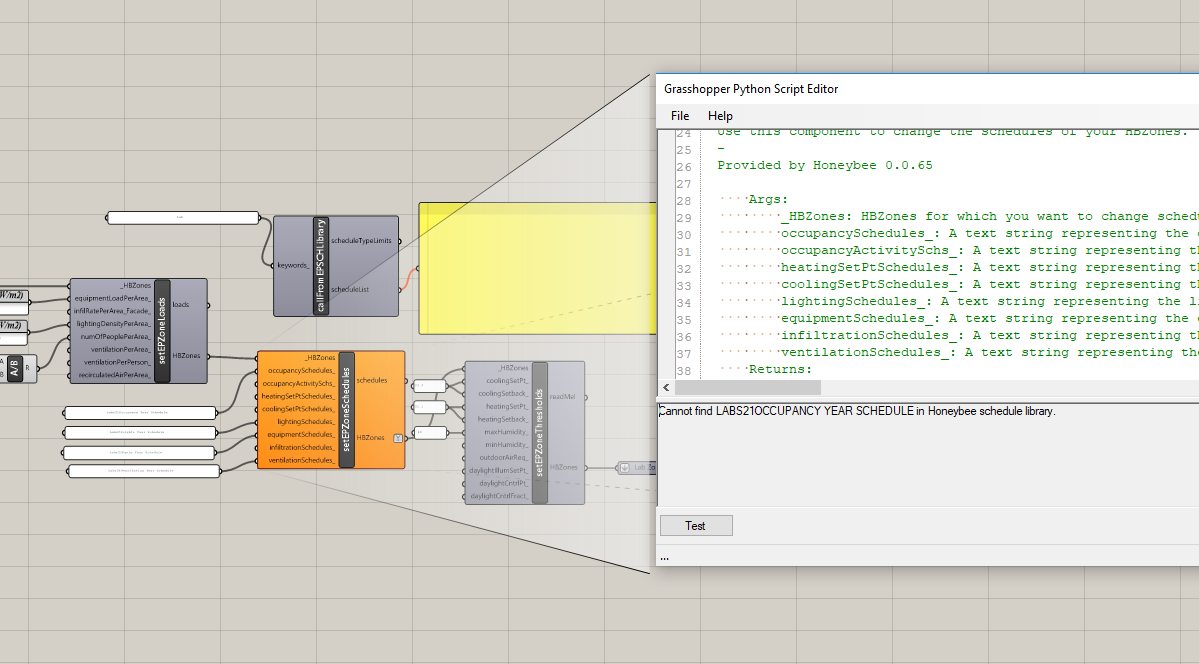
Hi @devang again, I started a new file and started putting components and connecting them but I get this error which I know has happened before and I read the solutions but it did not work for me and the weird thing is that the other file works fine and finds the schedule but the new one does not find the schedule:
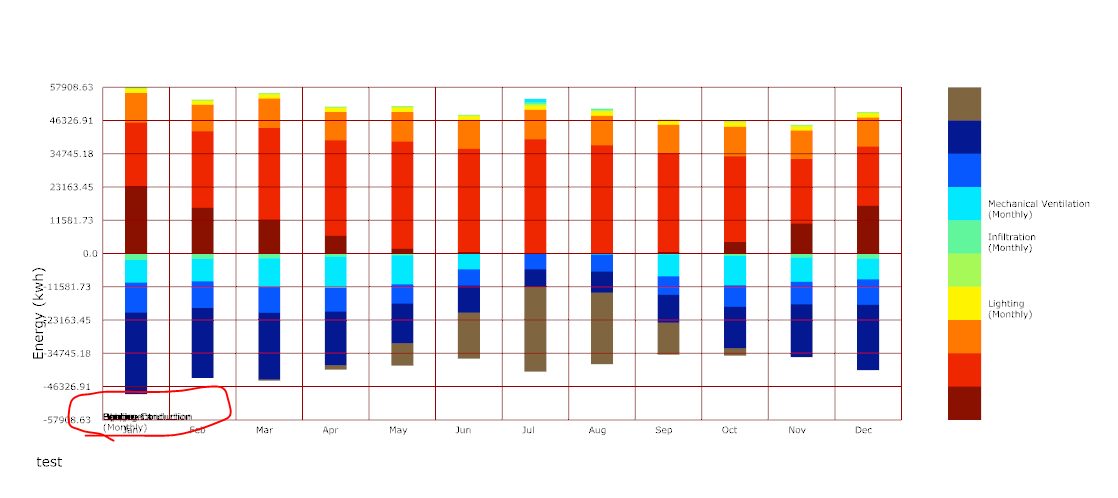
@devang@chris@mostapha I have a question that will help me to see if I can move forward with my studies. I would appreciate your response. Is the legend always the same? I mean the attribution to colors are always the same? For example, mechanical ventilation is always the same color for each comparison study? That way I can take Chris’s legend that had posted before and use that for all my studies because everything else works, and I need to prepare this for a conference so I do not have time to trouble shoot anymore. Thank you for your response in advance.
It changes based on the variables you request from a simulation.
Once you have a chart, create your own legend by picking colors using eyedropper tool. I believe you can very easily do this in InDesign or other adobe tools.