Hi! I am new to HB,
I got my eplusout.sql file and has energy consumption results and was able to visualize them in monthly chart but having trouble extracting the total energy consumption for each month in numbers.
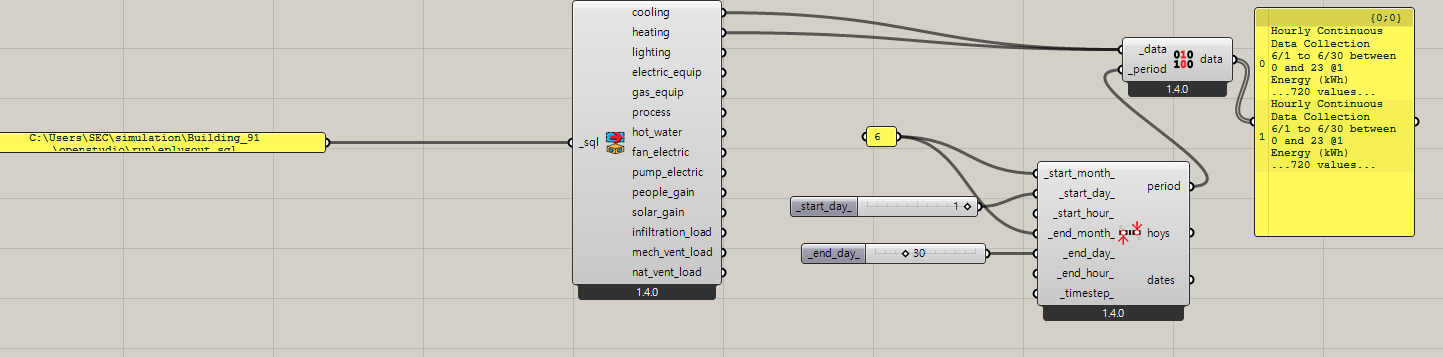
The attached is what I have been using.
I would like them to be extracted in numbers for each month… is there a better component to use in this case?
It sounds like you want to use the LB Deconstruct Data component to deconstruct those data collection objects into lists of 8760 numbers.
We use these data collection objects in the LBT plugin to represent timeseries data since it’s much more efficient than always dumping thousands of numbers into the Grasshopper UI and it allows us to do easy operations on the data (eg. apply analysis period, convert units, visualize them). And speaking of easy operations on data collections, if you want to write them into a CSV, you can use the LB Dump Data component to do this.
The epluszsz.csv doesn’t contain any data from the EnergyPlus annual simulation. It’s just a special CSV that E+ writes out when it does the sizing calculation before it runs the annual simulation. All of the interesting results are in the .sql file.