I would like to display the total hourly solar irradiance for areas of the roof and facade. and preferably create an output as an excel or csv file that we can then read into the simulation program. “AnnualIrradiance” has the average irr, peak irr, and the cumulative output as output parameters, but I need a list where I can see how much the total irradiance per hour is distributed over the whole year. a list with as many values as the year has hours.
I hope I have explained it well enough… My english is not so good.
I would be happy if someone could give me some hints on how we could best set this up.
Hi @Hotte
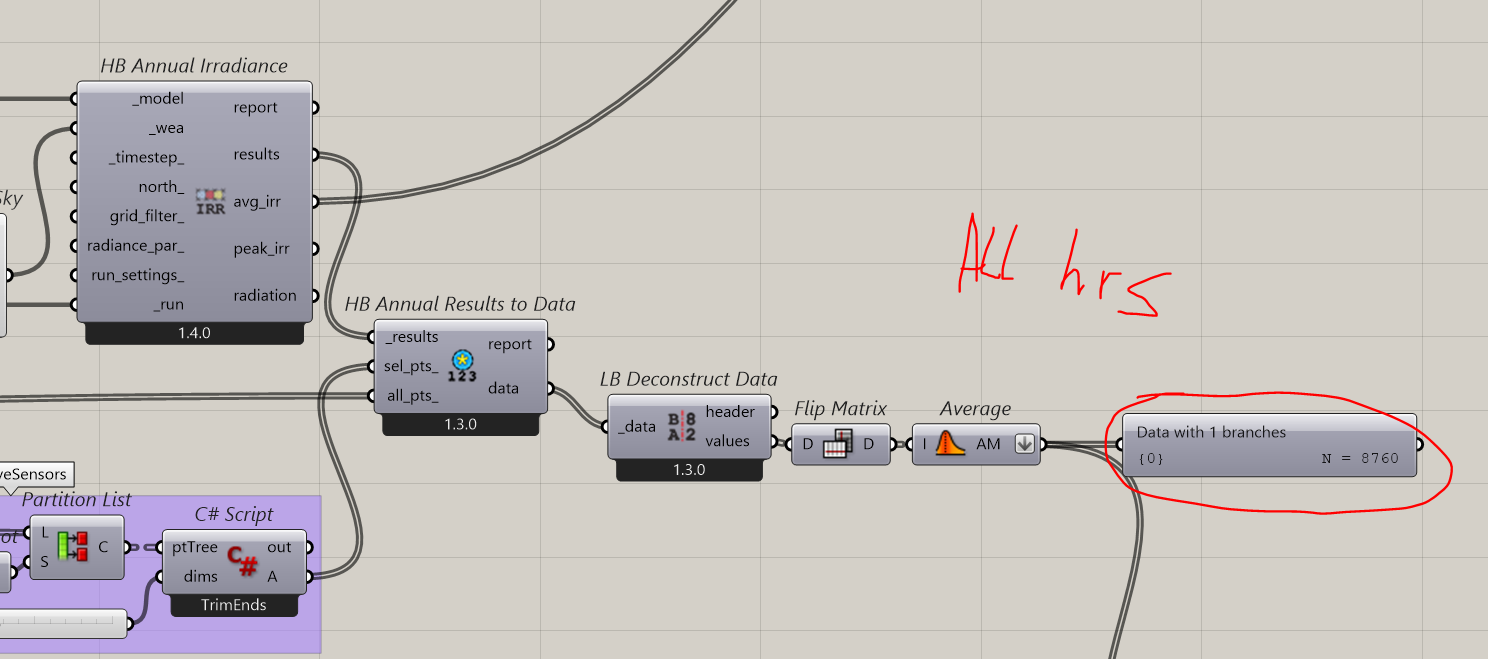
Many thanks for the hint and the super quick reply!! Deconstruct Data and the Flip Matrix brought us way further!So we could create the hour lists! The problem that we still have, is that we have complicated surfaces, with many forwards and backwards jumps, and so we have a very high number of sensor points and consequently have to process a large amount of data. But I think we can also solve that now with a little more effort… sooner or later…
Hi @Hotte
I want to do a similar model. However, I need it on an urban scale, not just for one building. The final output I need is the average hourly solar irradiation on each building envelope (including walls & roof). So, if there are ‘n’ buildings, I expect the output shall have n x 8760 values. Any idea on how to go about it?