hi guys
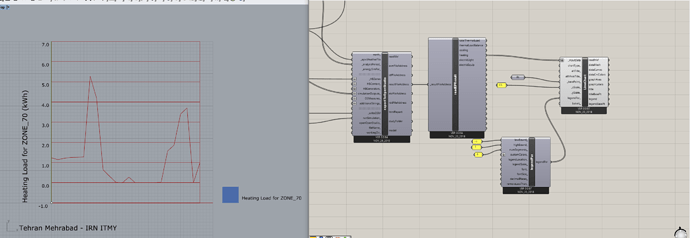
i need to show the result of a simulation on a line chart based on every hour on a day.
line chart component just show y axis label and value but nothing for x axis!
Can you please share a sample?
The line chart component does not label the X-axis (it’s just not something we built into to it). However you can create your own X-axis labels with native Grasshopper components, which you will see if you download this example
Built in X-Axis labels are definitely something the component will have when we make the next version of it in LadybugPlus.
2 Likes
