Hello,
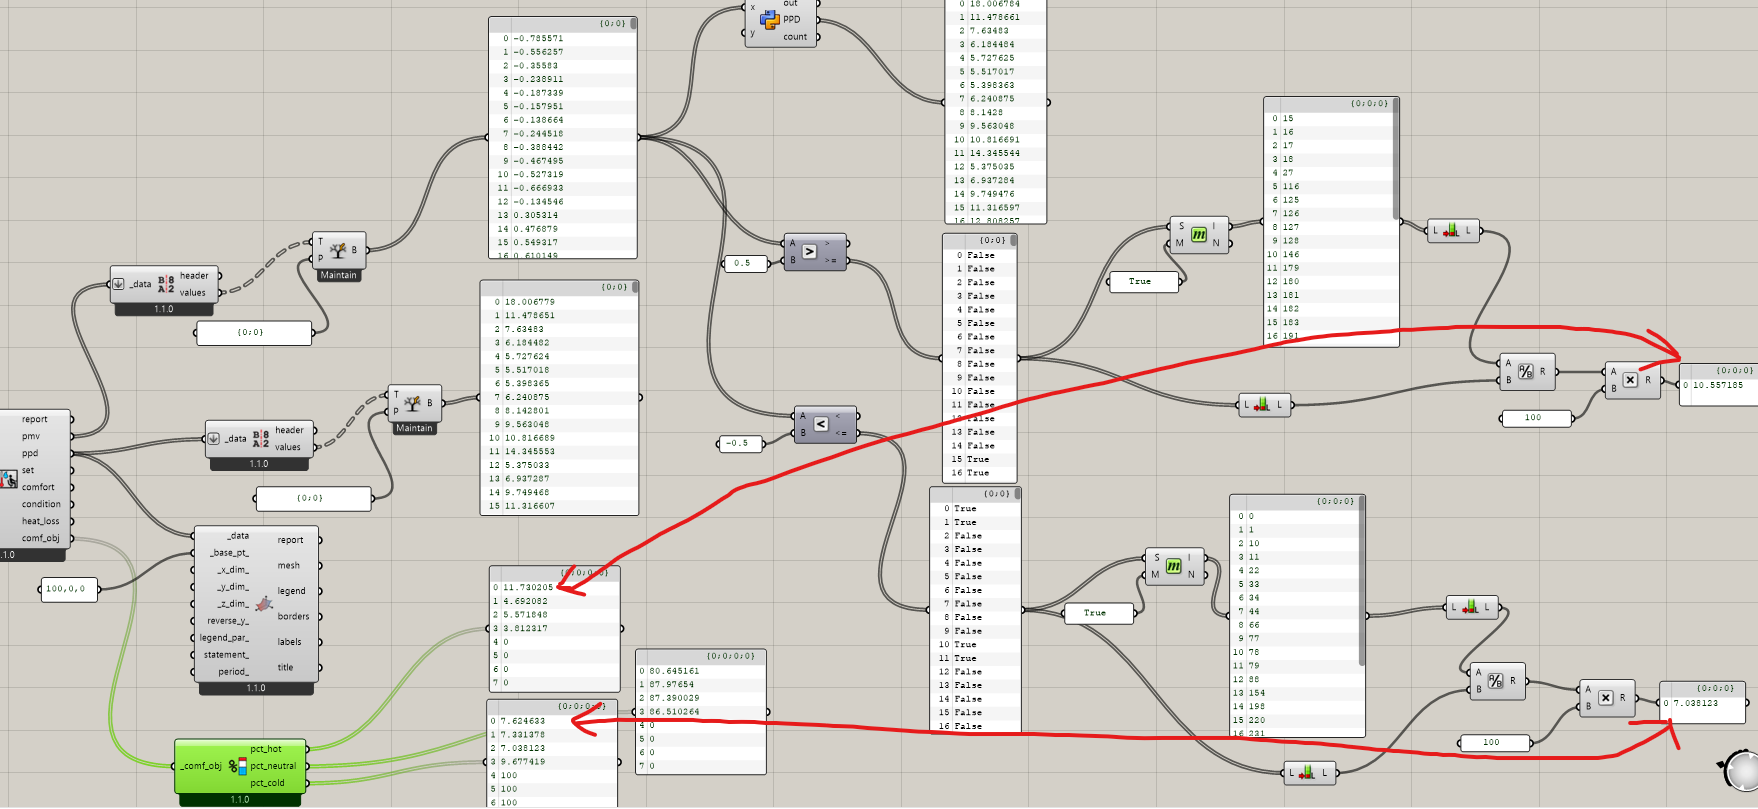
I have compared the results from de LB Comfort Statistics component with the Statistics obtained by hand and show different results.
The LB PMV Comfort component has the PPD threshold set to 10.
Thank you
1 Like
chris
December 26, 2020, 10:50pm
2
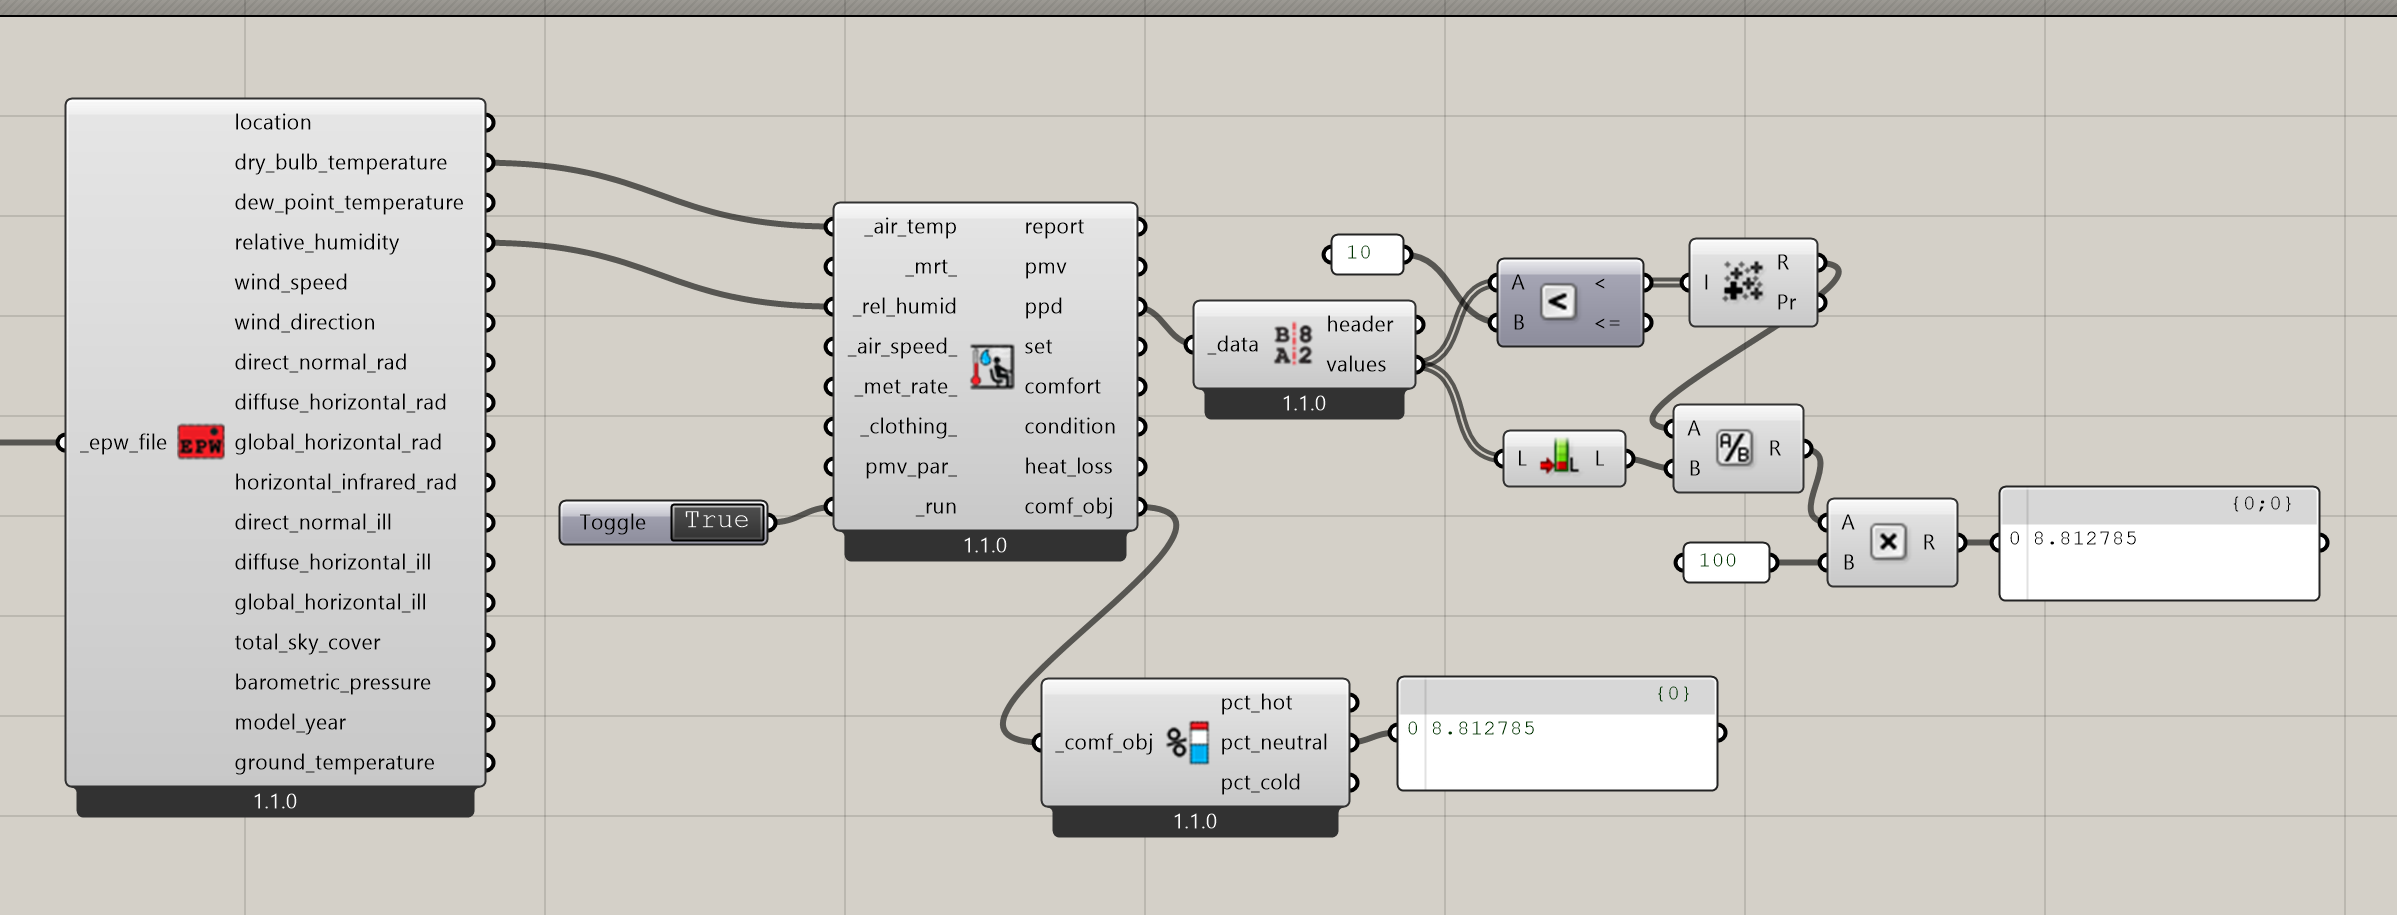
Everything looks good on my end:
Bear in mind that -0.5 and +0.5 correspond approximately with the 10 PPD threshold. The exact function between the two is given here:
def ppd_from_pmv(pmv): """Calculate the Percentage of People Dissatisfied (PPD) from PMV. Args: pmv: The predicted mean vote (PMV) for which you want to know the PPD. Returns: ppd -- The percentage of people dissatisfied (PPD) for the input PMV. """ return 100.0 - 95.0 * math.exp(-0.03353 * pow(pmv, 4.0) - 0.2179 * pow(pmv, 2.0))
2 Likes
Hi @chris ,