Questions about Using Hobeybee to Calculate Solar Adjusted MRT

Hello,everyone.
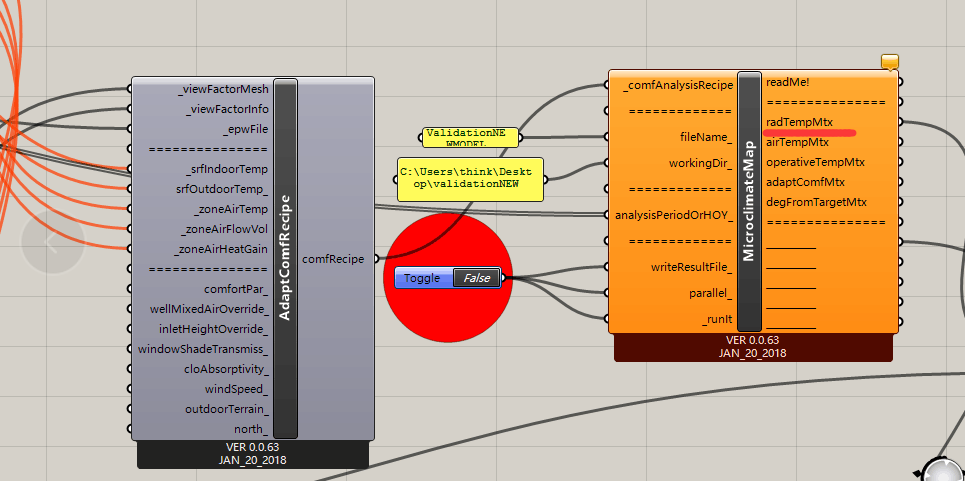
I have some questions about using Hobeybee to calculate solar adjusted MRT. As I understand, Honeybee uses Solarcal’s method to calculate solar-contributed MRT(△MRT), and then with the base MRT to obtain the solar adjusted MRT. The figure1 shows the method in Honeybee.

Now I use three methods to validate the solar adjusted MRT computed by Honeybee.
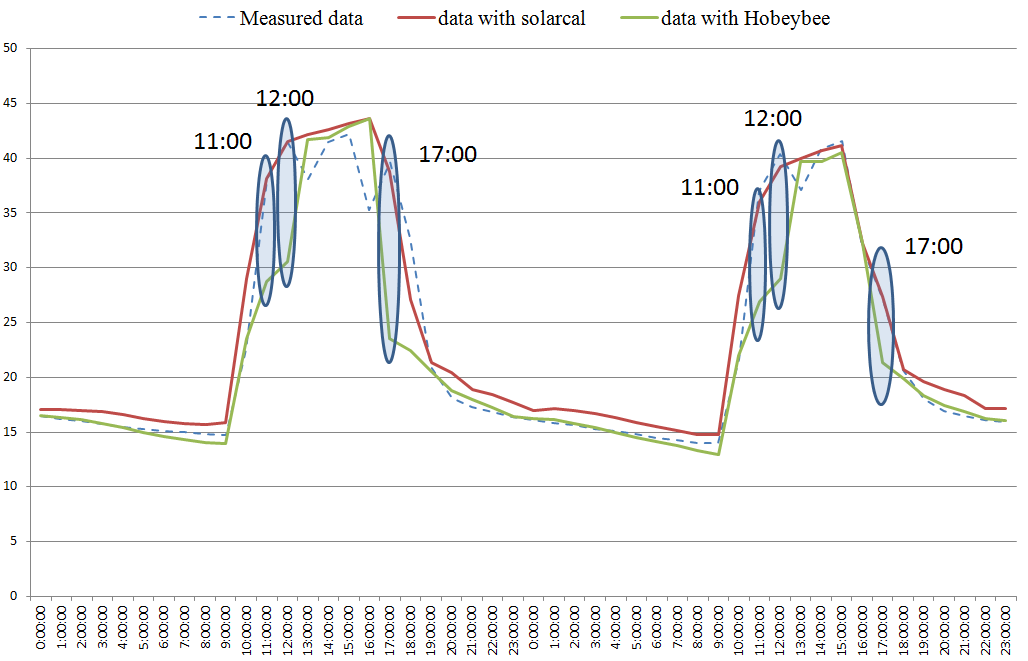
(1)Comparision with the measured MRT data. (all meteorological data inputs are measured data,Measurement period is from December 23 to January 31). Simulaton results are basically consistent at most of the time, but daily values at 11:00, 12:00 and 17:00, and 18:00 are significantly lower than the measured MRT data(Figure2).

(2)We first sse HB’s openstudio component to calculate base MRT, then use the SolarCal function of CBE Thermal Comfort Tool to compute △MRT , and finally we obtain the solar adjusted MRT according to baseMRT+ΔMRT (Figure 2). It was also found that the daily results at 11:00, 12:00, and 17:00 were significantly lower than the measured data.

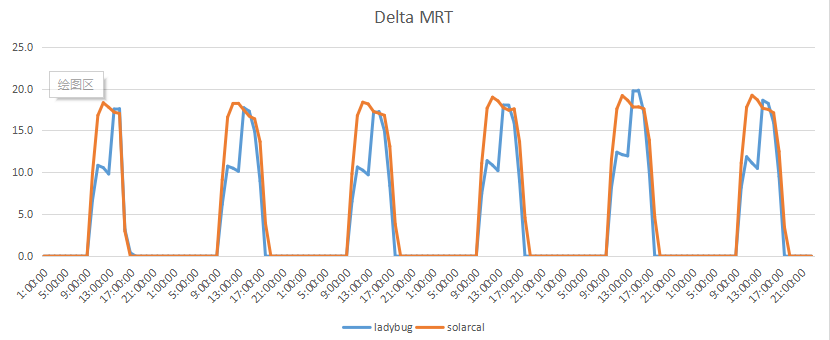
(3) We used Ladybug_Outdoor Temperature Adjustor to build indoor microclimate map for △MRT. and compared them with the △MRT computed by Solarcal tool. Great differences were still found at 11:00 and 12:00 while there is good agreement at most of other time(Figure3).
Therefore, is there any reason to explain the disagreement in the results of solar adjusted MRT. Besides,

  1. When using Honeybee to calculate solar adjusted MRT, is it possible to report hourly result of Fsvv and Fbes?
  2. When using the Microclimatemap component to get solar adjusted MRT, is it possible to display the results of base MRT and △MRT separately?

    Hope to get your reply.Many thanks.

MRT.gh (918.0 KB)
CHN_Tibet.Lhasa.555910_CSWD_DRYT_1.epw (1.5 MB)

@mercury1123 ,
Sorry for the very late reply and thanks for doing this comparison. I’ll try to respond to as much as I can in the time that I have now.

To clarify, the Honeybee microclimate maps, the Ladybug_Solar Temperature Adjustor, and the CBE SolarCal tool all use the same fundamental SolarCal model under the hood. So, if the results do not match, it is because one of the ~8 inputs to the SolarCal Model is not being matched between the models.

To clarify some things about the microclimate maps, there are some slight simplifications that are going on to help the microclimate maps run faster than the Solar Temperature Adjustor (so the temperature adjustor can be seen as a more accurate way to run the solarcal model but it requires more inputs and more time to run). The critical simplifications in the honeybee microclimate maps are as follows:

  1. The exact solar position is not being used to determine direct sun falling on the body but rather which “sky patch” the sun falls into sets where the sun comes from. This is similar to how Daysim computes annual daylight metrics and so it’s subject to a similar margin of error.

  2. The microclimate maps really only have a 0 or a 1 in the place of the Fbes input for the SolarCal model since it’s evaluating a grid of points. However, the solar temperature adjustor uses as least 3 points over the body to determine the fraction of the body in direct sun.

  3. The microclimate maps always assume that the person is facing to the side of the sun vector. This is meant to approximate occupants turning away from the sun so that they do not experience glare. For the Solar temperature adjustor, you can rotate the body around to face any direction.