Hi.
I developed a readiation analysis for two periods (1st oktober - 1:00-24:00) and (1st june 1:00-24:00). I would like to show the amount of kwH per m2 of one day and compare the fall with the summer day. (EPW from Frankfurt, Germany)
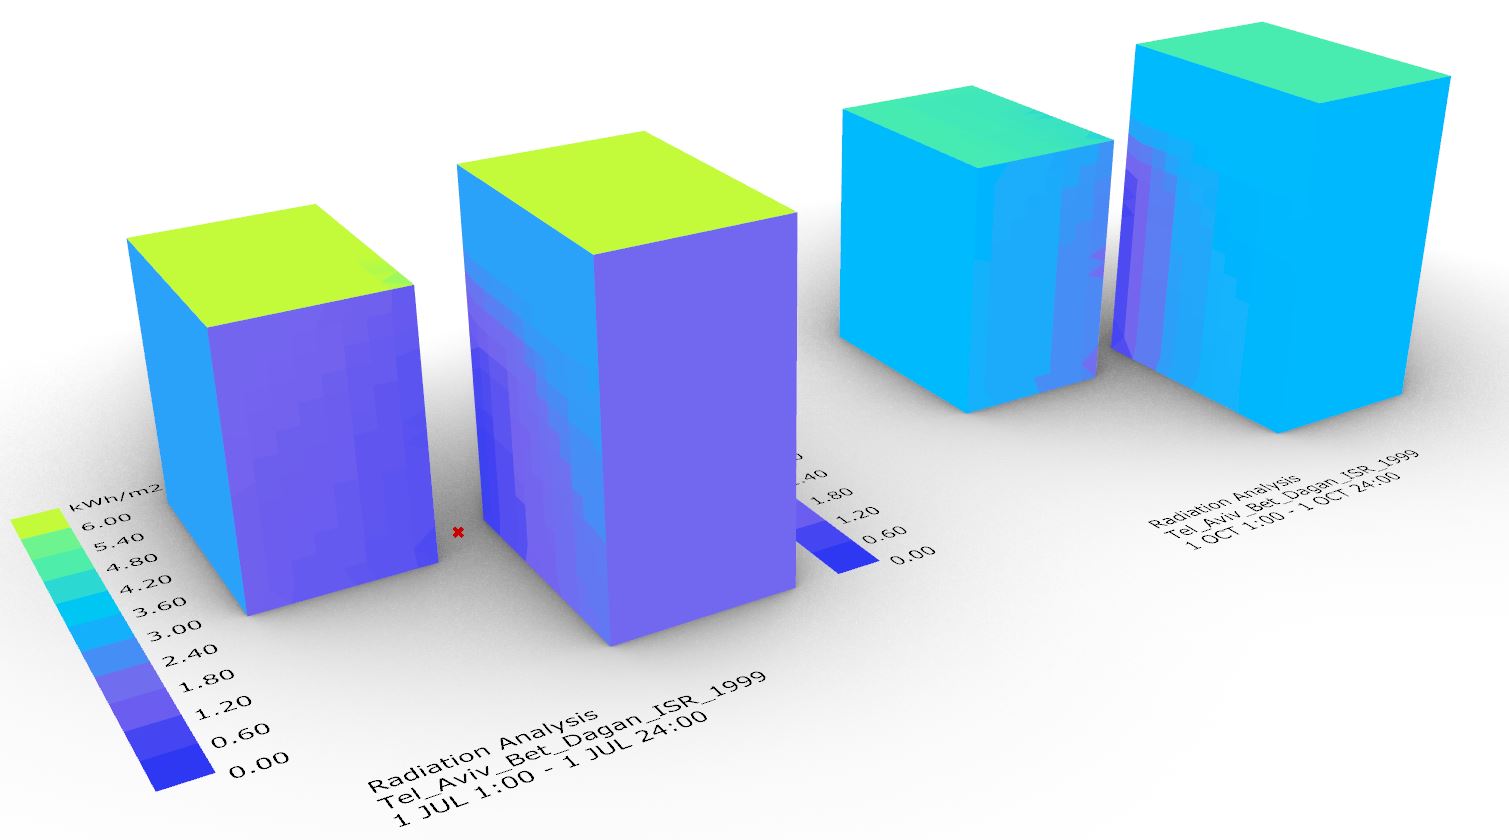
My visualized result does not really make sense to me, because my summer day example shows way less radiation amount than fall example.
Hopefully someone can help me. Thank you for your time!
I tried to check your file. It was taking a very LONG time to simulate, so i stopped it. Then i tried a simplified version.
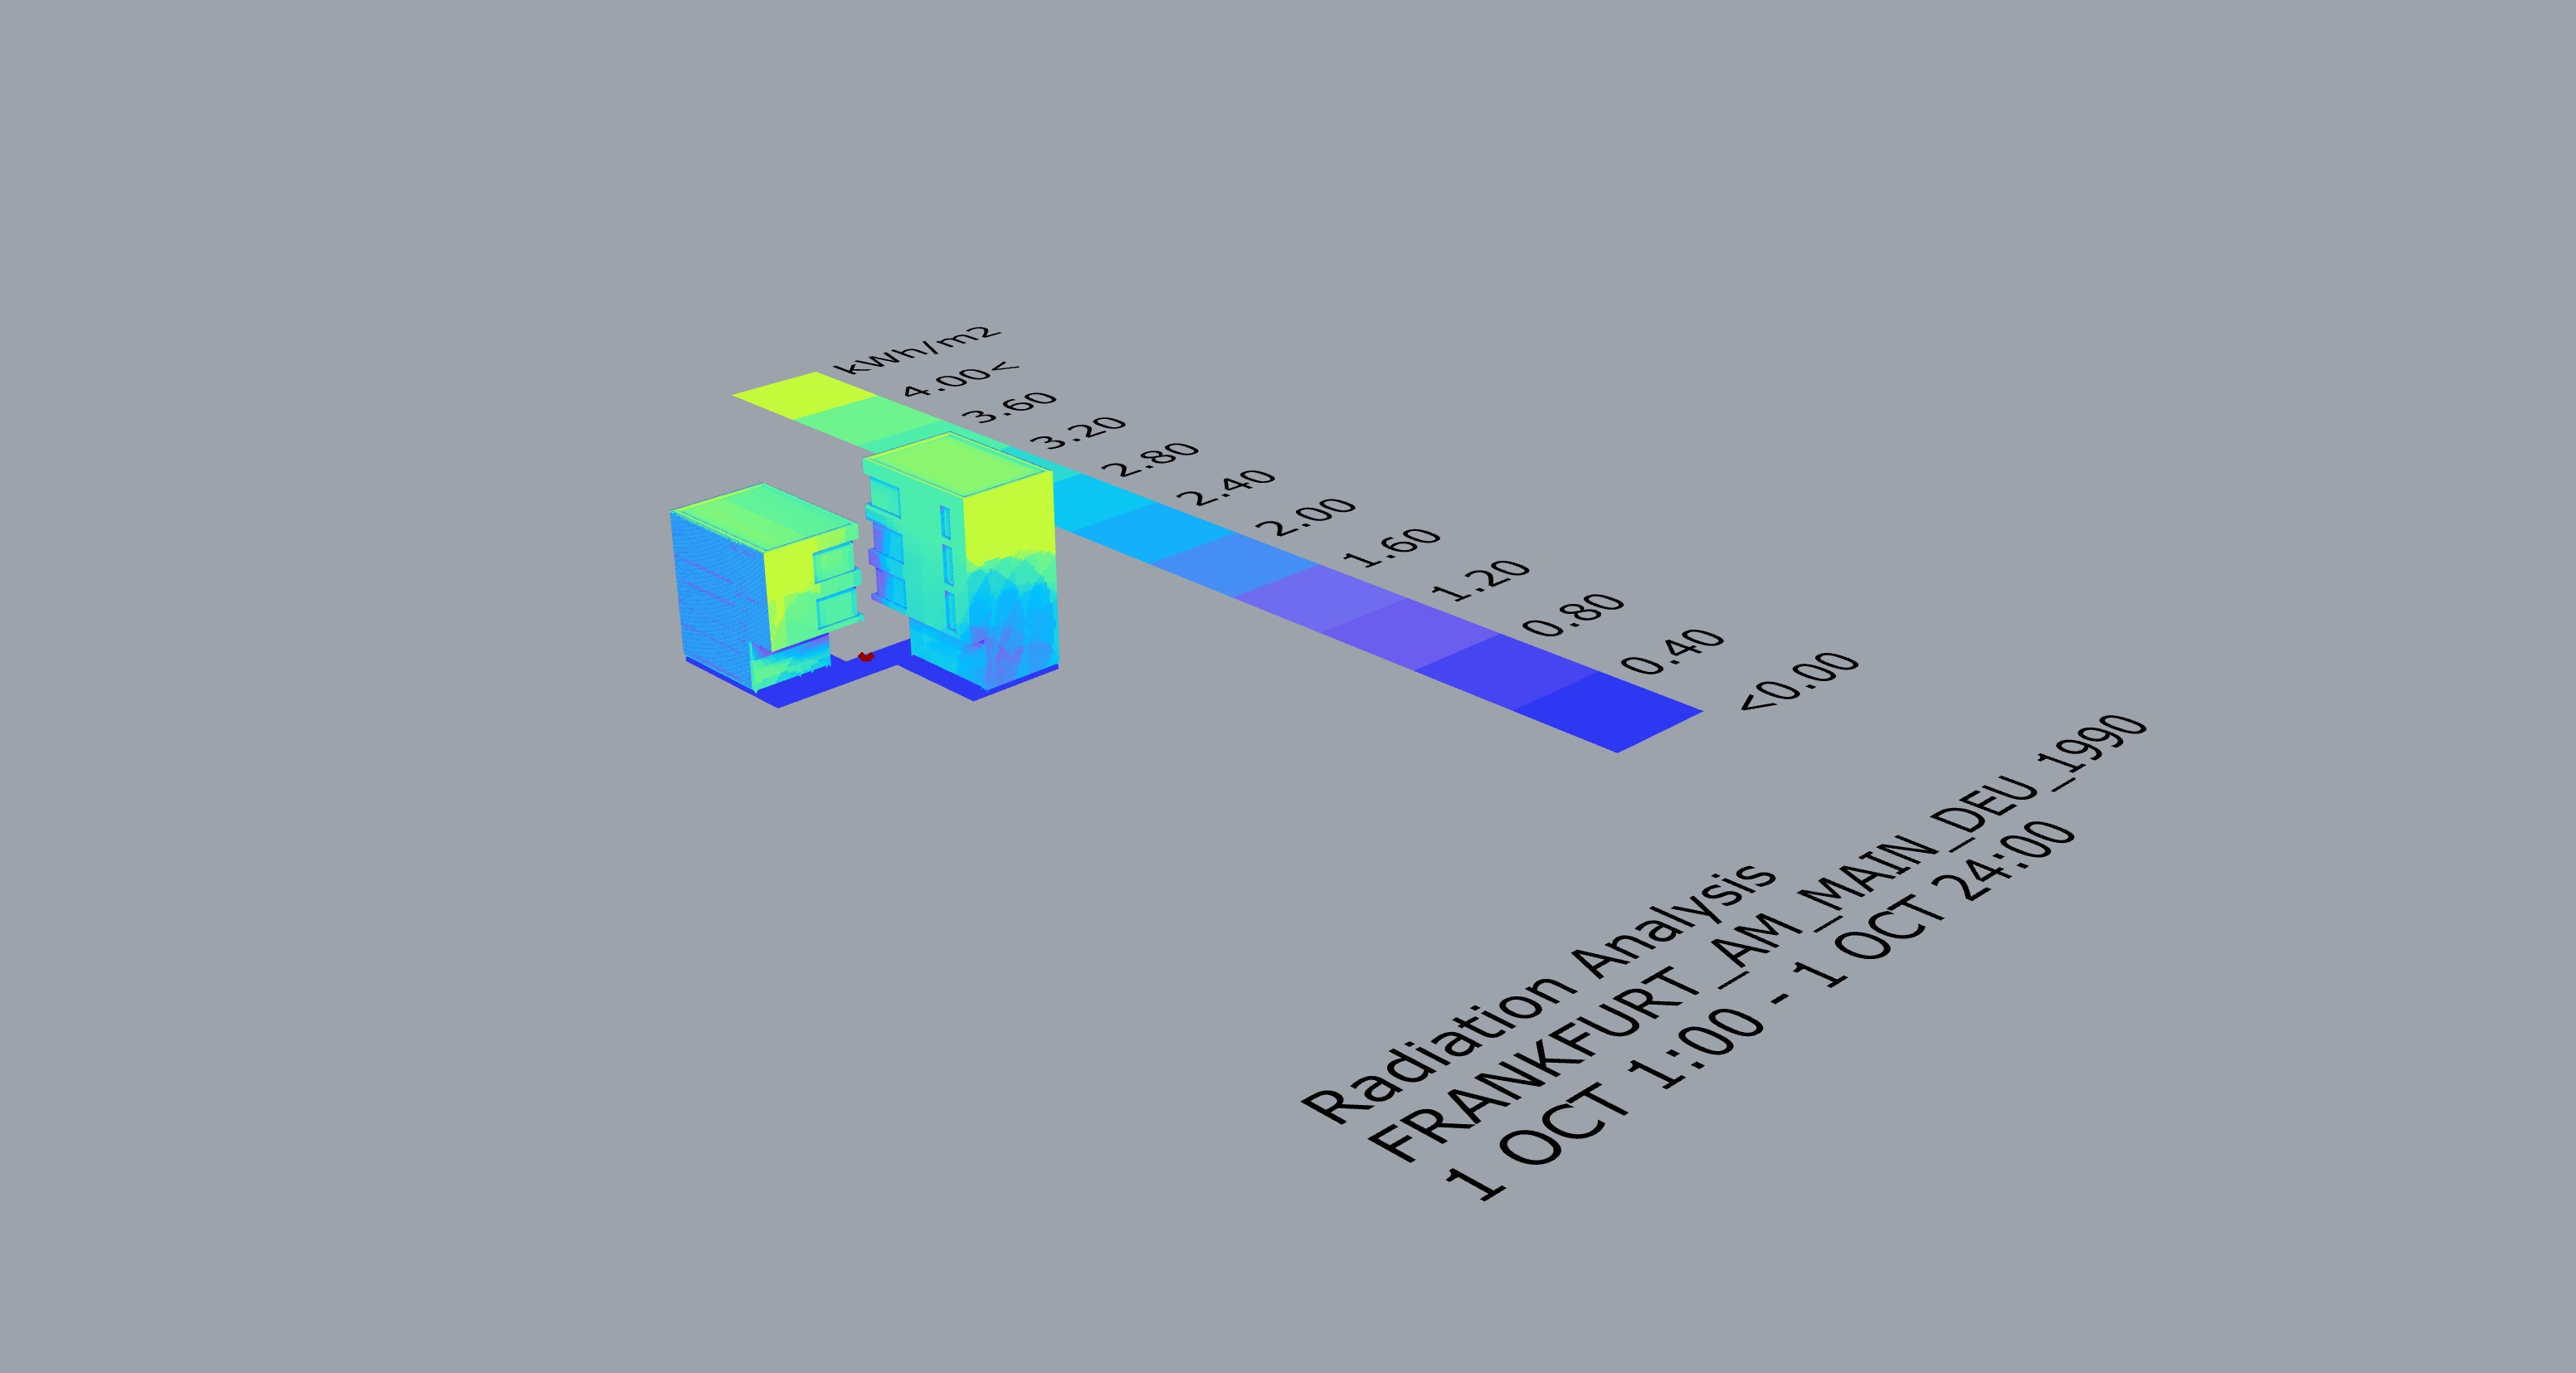
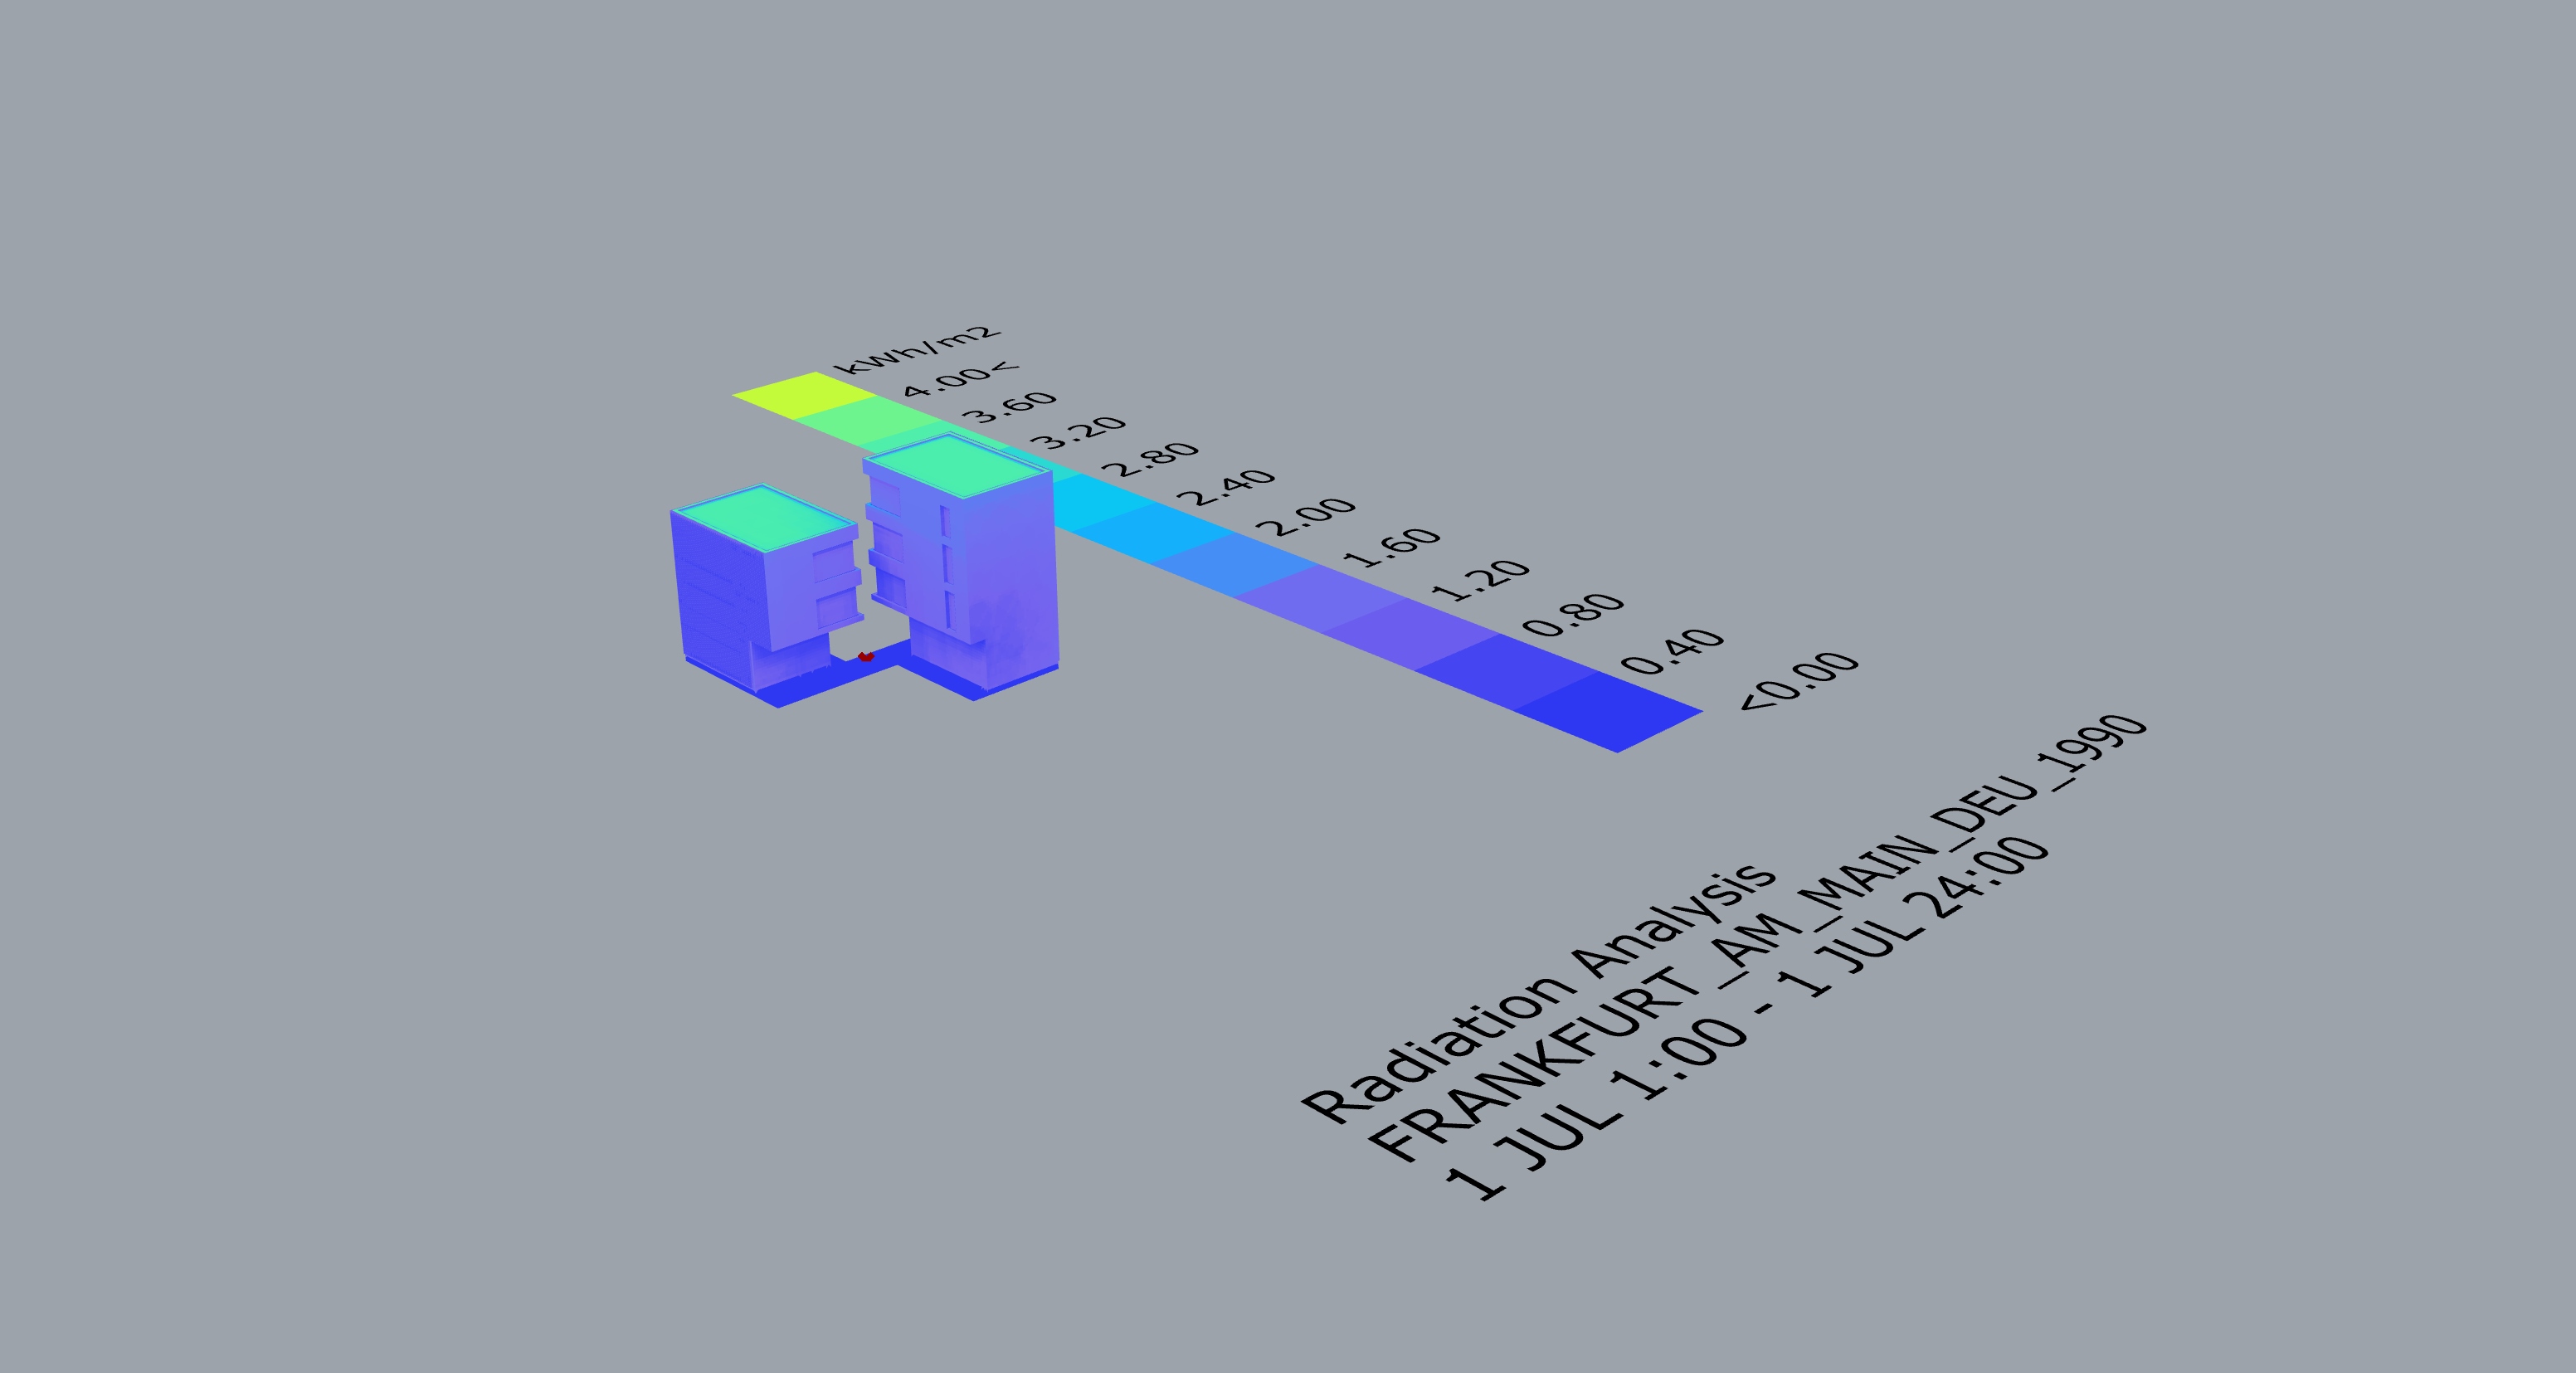
It is running fine and the results make sense. You need to take into account that in summer time the high sun is (probably) having less radiation in south facades.
From the image below you can see that. Besides the image i’m attaching the rhino file with both simulations so you can see all facades.
In short, the results (at least for my location) make sense.
-A.
RadCheck.3dm (307.1 KB)
1 Like
Thanks a lot for your help!!
I checked my definiton one more time and I still get different results than you.
Your result shows the <6 kWh result for summer 1 JUL and way less radiation at fall 1 OCT.
My Result is different. Please look here. I am not sure why I do not get the maximum radiation for summer time. Please ignore context in my examples
I would recommend to check the source, which is the EPW data.
It can be that for the specific dates you are checking the results are indeed opposed to the logic.
Check with the LB_3DChart what’s happening with the radiation at those dates (or just check the data)…
To be on the safe side i will try to simulate the whole months instead one specific day. If OK you should receive what you expect.
-A.
1 Like
Thank you for your quick response. When I decide to expand the periode, what means that I simulate whole months, is there an high increase of calulating time for that?
Not much,
I suggest that while you are setting and calibrating the simulation, use a simplified geometry.
As i wrote before, your geometry is heavy (very low, or high mesh resolution). Anyway, the calculation time is not suppose to increase (much) if the period is longer.
-A.
Are EPW files only a storage for sun positions & vectors or
sun postions, vectors and weather conditions (cloud density, etc.?
Because what I need is a key date for every season that represents the several seasons individually. Maybe it is an average day of the season? I am not sure.
Would you rather recommend to construct an average day of every season or expand the period for all days of one season?
See the outputs of the importEPW component. From there check the radiation (Global Horizontal).
What i said is to look weel at the data for the day you are taking. Can be that by chance they are contrary to your logic (summer > fall).
Don’t recomment to construct any average data. What you need is in the EPW.
Test the month just to be sure it makes sense, or check various individual days … just don’t rely your conclusions for what happens in one specific day.
-A.
I could finally receive good results. Thanks again for your help!
I just wanted to confirm some of what @AbrahamYezioro is suggesting here, since it’s somewhat counter-intuitive to our understanding and experience of the sun (and was really confusing to me the first time I encountered it).
It is possible for solar radiation on a winter day to be greater then on a summer day. At a latitude of 45 deg, the direct normal radiation on Jan 21st at noon is 878 W/m2, while on July 21st at noon it’s 864 W/m2.
This was explained to me as a consequence of the earth being closer to the sun during January then in July (at it’s perihelion). Thus while on average there is less solar radiation during the winter due to fewer daylight hours, and the longer atmospheric path length - you can get higher solar radiation intensity during the winter versus summer.
Which is why you don’t want to rely on one specific day to draw conclusions like this.
S
2 Likes
I understand your point. I am not sure about that, but I agree that radiation density can be more intense in winter, when you just focus on sun position and a total cloudless sky.
But with real weather conditions the situation of maximum radiation in winter and summer depends on the cloud density of the sky, right? I am not sure if this cloud density information is integrated in the epw files. Maybe you can tell me if the standard ladybug radiation analysis with an pre-setted period attends the cloud desnity of the several hours of my analsis period.
Thanks for your help!
In general EPWs are real conditions (as you wrote). They are measured data over a span of few years…
-A.