Inspired by this thread, thanks to @RafaelA @chris @mostapha and others.
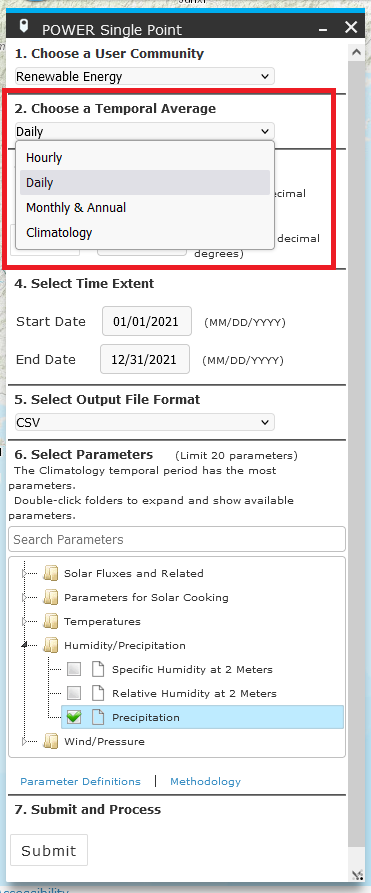
Lately I found NASA POWER Project, where precipitation data can be downloaded from. (The database surely contains other parameters, but precipitation is primarily what I’m currently looking for).
The database also has hourly data, and time period can be selected.
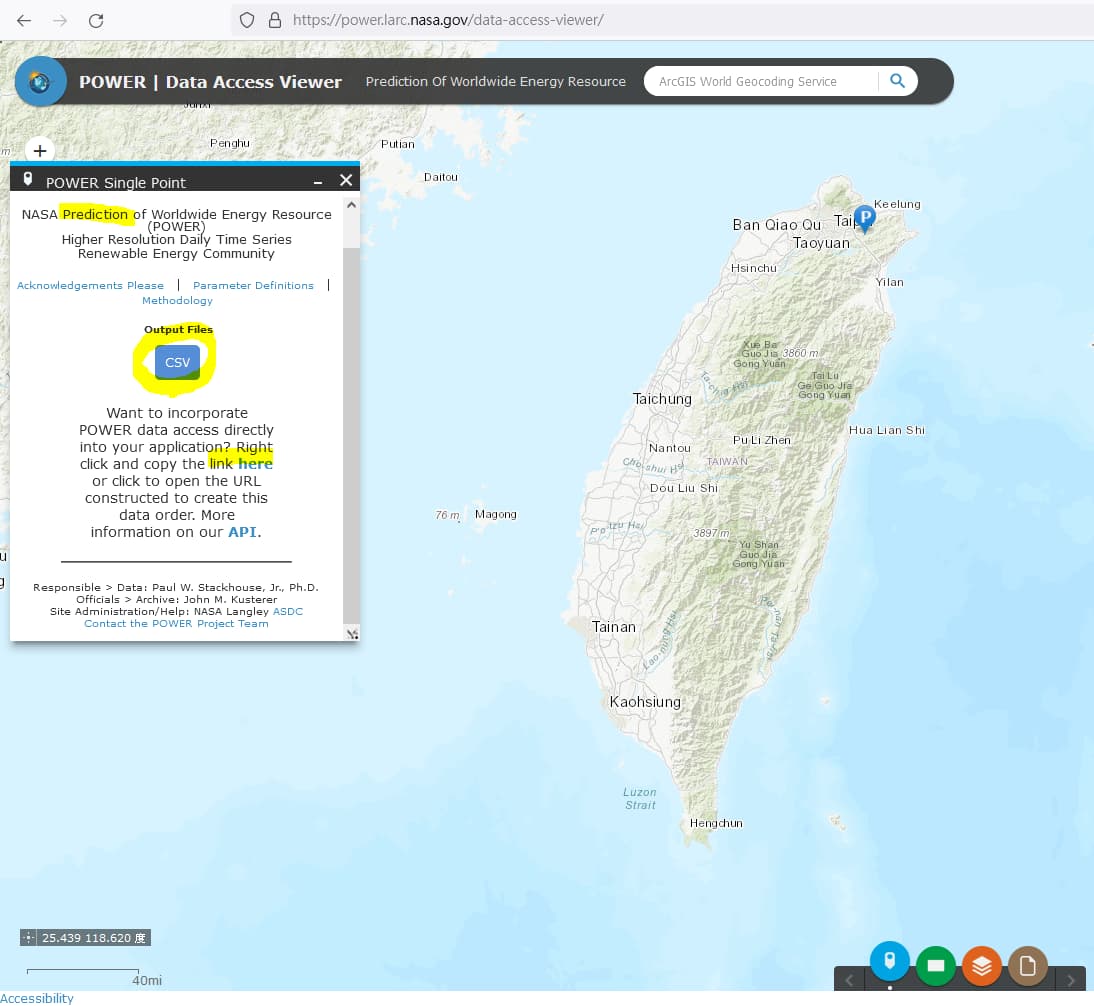
The approach is pretty much the same as @RafaelA’s version, CSV format is used.
The component requests the appropriate data according to the location, which is downloaded in a .csv format and read back into Grasshopper (i.e. The EPW location is used).
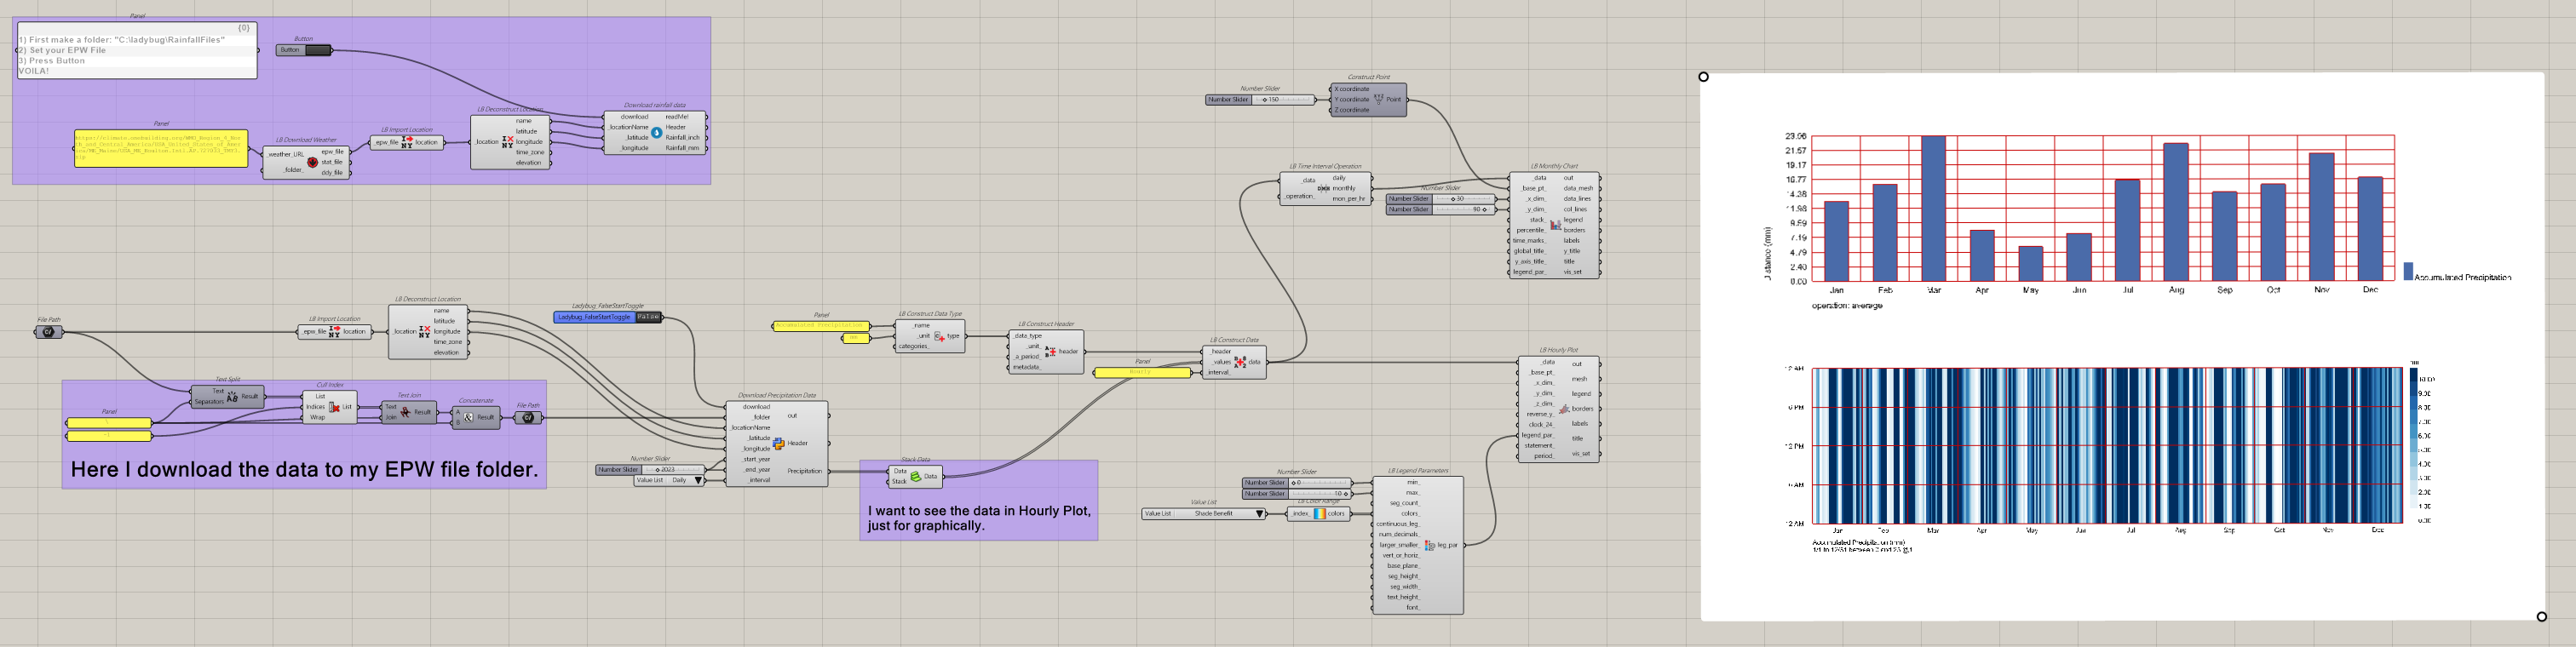
Below is how it looks in GH (Interval = Daily).
Precipitation NASA POWER.gh (48.8 KB)
Since I’m not from a coding background,
some obstacles remaining and I hope people can help ![]() :
:
-
Leap Year -
I don’t know how EPW deals with 2/29, but in the case above, I hope there’s a way to automatically filter out the data for 2/29 to fit into the overall 365/8760 system. -
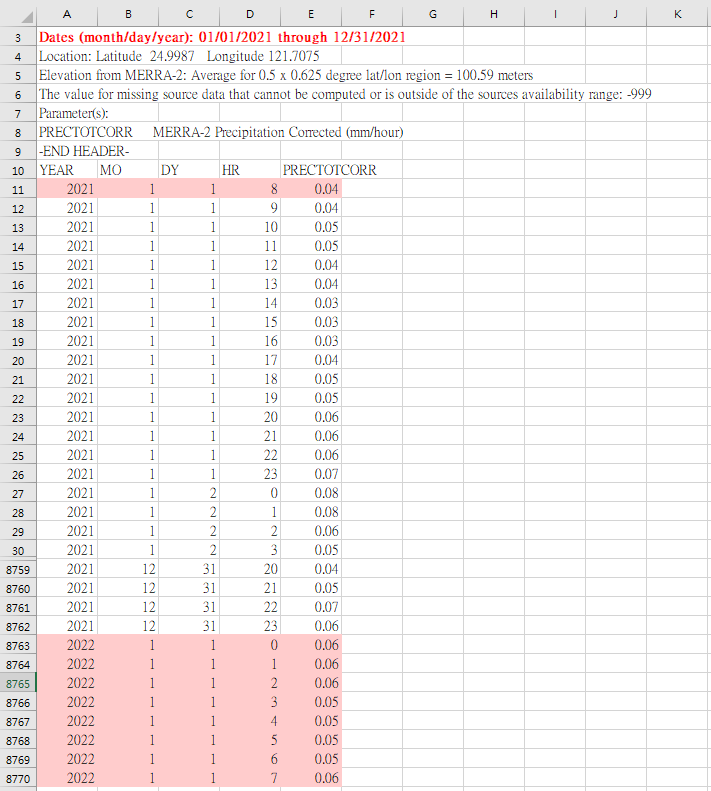
Hourly Data -
Below is the hourly data downloaded in CSV format.
(The time period entered is 2021/1/1 - 2021/12/31)
As you can see, the first hour starts at 8 am (sunrise?) and ends at 2022/1/1 @7 am. Although it’s artificial, perhaps there’s a way to move those later hours to the front so that the entire dataset fits into the correct 8760 order?" -
Data Request Method -
Since the POWER API allows external application developers and users to directly connect and interact with POWER’s Data Archive, I believe the workflow “download > read” can be improved. -
Matching EPW Model Year -
Since EPW files are synthesized from real recorded data from different years in a given climate (monthly), perhaps the data request time extension can be set accordingly? January 1, 2001, appears to be the earliest date for the available data.
I would greatly appreciate it if you could provide feedback and ideas regarding the above.