8760 visualisation from Incident radiation...How do I do that?

I love LBT and the ability to calculate the kwh/m2 I get on a building surface, but how do I generate a 8760h report of the data?

I understand that the results are summarized on a patch/analysis grid level and can see how much each point get over the entire year, but would it be possible to get the data on an hourly level and add up the energy received?

…Is there some way I use the LB real time incident radiation and connect it with the Period data to generate an hourly plot?

thanks!
anders

1 Like

Hopefully, the “LB Directional Irradiance” component gives you all that you need. It will give you a data collection of hour-by-hour solar irradiance on a surface facing any altitude and azimuth. It is fast but the only big limitation is that it does not allow you to account for context shade.

If you need to account for context shade, things get a lot more complex and time consuming. Technically, there’s a way to do it with the “LB Realtime Incident Radiation” component but it’s going to take a long time to run. At that point, you are probably better off using the “HB Annual Radiation” recipe instead and you can just parse the output .ill files into Grasshopper to make your visualization.

Hi Chris,
thanks for your suggestions. I really need the shade components as I’m trying to compare the opportunities for BiPV on different facades of a building and self shade as well as external shade is a huge factor. and visualizing the 8760 data on a facade by facade basis would make this easy and intuitive. I don’t mind that it takes over night to run, if i can just do it…, but I just can’t figure out how.

I’m trying to get started on the HB Annual Radiation path, but struggling with how to set up the geometry/sensor grid and have attached a few screenshots (wouldn’t let me upload files as a new user) and it would be super grateful for any suggestions and pointers to where I can find samples, but after digging around I haven’t found any…especially not for HB 1.1.2

Thanks a bunch…This is really helping we convince people of the value building integrated photovoltaics bring towards making netzero architecture, so please keep up the great work

anders

![bldg|690x364]


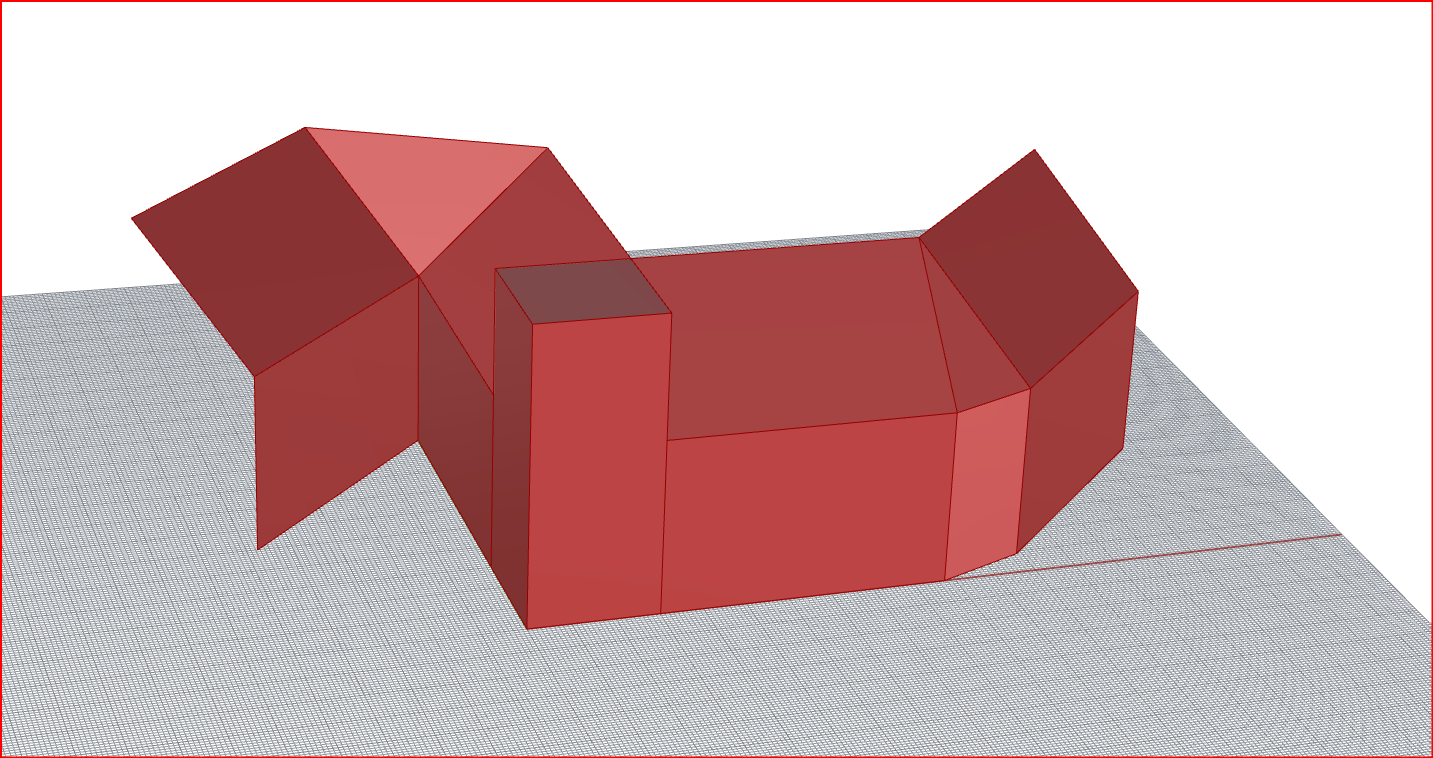
This is the simplified architecture I’m trying to evaluate and have selected all as shade components and some of the also as Faces to see the energy they receive is this the way?

I’m completely at a loss the regarding the red error that it needs -Positions…how do I create these?

thanks
anders

Here’s an example of how to do it for a Box and a couple of points but you can change the input geometry or add as many more points as you like:

Hourly_Irradiance_Visualization.gh (37.5 KB)

1 Like

Thanks!

This look super exciting and I can’t wait to play around with it.

When I run it I get an error from the ‘read file’ modules that there is no valid parser available…I tried reinstalling Radiance and OpenStudio, but without luck…Am I missing a component?

anders

I’ve been playing around with HB AnnualRadiation (inspired by work of @AbrahamYezioro ) and is wondering if I will get the correct total radiation when I multiply the area (output from the GenPts module) for each test point with the received radiation (from AnnualRediation) and then add them all up…

I think maybe not, as I get a very different total received radiation that when I use LadyBug, but how could I do this?

thanks
anders

Thank you Chris! been working with it recently and tying to go around!

Hi Chris,

Based on your feedback/sketch and what I have been able to scavenge I’ve tried building my ‘wet dream’ of a sketch that will calculate and visualize everything I need to evaluate the potential for BiPV on a building…in 1.2.0

  • 8760 excel via a .CSV streamed from a panel
  • 8760 visualization (I’m hoping these are per panel group as I set them up as separate sensorgrids)
  • On mesh visualisation of the location and and intensity of the received radiation taking into account the context and self shadows
  • Panel/facade area in sqm (taken from the mesh areas)
  • Yearly radiation per Panel/facade area i kWh/y
  • Yearly power generation potential per panel/facade area in kWh/y

As you can see I’ve only just gotten started and would love to get some suggestion on how to get things hooked up correctly.

  1. Especially the incident radiation per panel area where I’m not sure how to get the correct data.

  2. The second issue is the error I get from the Heatmap where it seems ‘the number of colors does not match the number of faces…’ and I gather I have hooked things up wrong here at some poBiPV study sketch in HB.zip (132.1 KB) int… here is a screenshot

…and the rhino and grasshopper files in a zip.
https://discourse.ladybug.tools/uploads/short-url/uPKNBrmW7RtPCN9M9jqnu7w82Lx.zip

Any hints/pointers or help will be greatly appreciated.

thanks
anders

Thanks for pointing the way, this is super cool.
Is there a way for be to combine the two plots (continuous collections) in one?

I’d like to multiply each collection by the area to get the total received for an area and then add it with similar collection for each of the other BiPV areas on other facades to present a combined plot that visualize the total energy produced for every hour of the year… and then I can also stream this to a csv/excel file for the energy consultant to have the 8760 file they need.

I apologetic if this is simple math thing, but its outside my expertise and I’ve been trying all the ways that I could think o,f with no success and hope that someone here can help get me unstuck

thanks
anders

Hi Andersmith,

In short, yes. The 8760 mesh plotter component just expects an input of a list hat has 8760 pieces in.

You can get the area using the area component in grashopper, and multiply them together, which grasshopper should interpet as multiplying each item in the list by the area factor.

Then, once you have a bunch of area multiplied lists that are 8760 items long each, you should be able to add pairs at a time using the Add component in grasshopper, which as long as the lists are the same length Should add the first tw items, then the next two and so on to produce a final listthat is 8760 items long, which you can feed into the mesh plot componenet

That was super helpful, hanks,
I’ve made it work like this:

Now my question is if there is a way to use fex LB MassAddition (I tried and failed to make it work) to automatically add all the collections from each test point, so that I can use the GenPths/SensorGrid modules to create a detailed sensorgrid to measure radiation on a buildings many surfaces and them have them all added back into a single hourly plot and 8760 file.
This would make it possible to evaluate the potential for Building integrated PV and at the same time provide a good visualization of the production distribution over the year and day.

Can anybody tell me where to get the recipe “HB Annual Radiation”? I installed ladybug / honeybee. do i need an older version?

@Moritz ,

It has been renamed to HB Annual Irradiance and it’s generally been refactored to give much more accurate results.

Also, the HB Annual Results To Data component can be used to load up the results to data collections without the need for all of the extra components in the samples above.

1 Like

thanks @chris !
through long simulation times of “LB Directional Irradiance” its not the best solution for me cause i would like to do a optimisation with galapagos… i tried to do it with the results of “LB Incident Radiation” and would like to cull all modules below a specific value caused by shadowing. is it possible to sort the desired modules off caused by a specific value in a list? i guess my problem now is that i don’t know how i can match the values in the list to the modules displayed in rhino… let me know if i shall attach the .gh file!
thanks in advance!
moritz


Unbenannt

I’ve been trying to create 8760 plots that reflect partial shadowing of a surface by making a grip across the surfaces and adding up the results, and it seems to work, but there are couple of things that makes me doubt my work and I’d love to hear what I’m doing wrong.

In the attached sample I only have two surfaces, but get 4 collections…and if I have 3 surfaces I get 9, yet the results seem to be Ok.

Any suggestions on how to improve or explain what is going on?
I’ve attached the file with internalized data…and a screenshot

thanks
anders


HB Radiation Questions.gh (106.9 KB)

Hi @anders ,

It looks like something fishy is going on when you create the sensor grid. If you expecting to get out only two data collections, then make sure that there are only two _positions and two _directions_ going into you HB Sensor Grid component. Flattening those two component inputs will also ensure that the _positions and _directions_ are aligned with each other.

Thanks @Chris,
I think the problem was that I had also connected the base geometry, so it generated an 8760 for each.

I’ve progressed further and now generate an 8760 for each sensor point, multiply it with the area is represents, to get the energy received before adding them all up to get an estimate for the combined area…I’m not sure I’m doing the math correctly, because I now get a much lower total than I get with LB (1/100th).

I’ve attached a screenshot and the gh file…Would you mind reviewing it?

a feature request: By the way would it be possible to add an 8760 output to the LB components, so it could generate both the on-building visualisation and an 8760 hourly plot of the total energy received?

thanks
anders


HB Radiation Questions2.gh (112.4 KB)

Hi all, I have been trying to do something similar (extracting hourly radiation data on a roof) but I get an error saying “1. Solution exception:Recipe “annual_radiation” is not installed.” and I cannot understand where the problem is. Any idea anyone?

Test.3dm (73.2 KB)
GB_Radiation_Analysis_220405-01.gh (46.7 KB)

Hi @anto.ac,

You are using an old component. Annual Radiation changed name to Annual Irradiance some time ago. Replace with Annual Irradiance and it should run.

2 Likes