I want to calculate how much passive strategies help the building to improve it’s performance by programs or zones for instance residential area or offices. In fact i want to reach to data to be able to draw a diagram like this. Does anyone have any information on this?
If you use the new LBT Plugin, the shoe_box_annual_loads.gh
that comes with the Food4Rhino download should help you here.
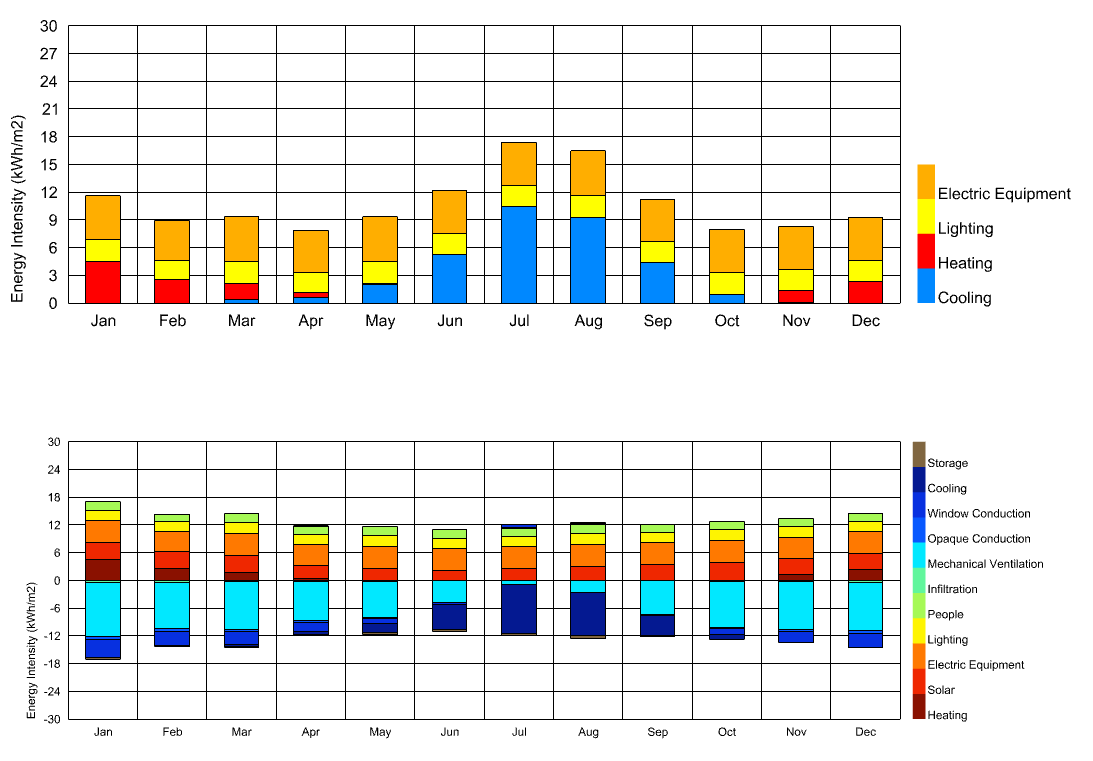
You’ll see it has a quick way of outputting the annual load balance of a set of honeybee rooms:
FYI, we don’t have DHW in any of the honeybee plugins yet but they’ll be in the next stable release of the LBT plugin.
How can we read the numbers behind those diagrams? I cant find a way to extract them in Grasshopper, as I only see Honeybee Headers, fx: