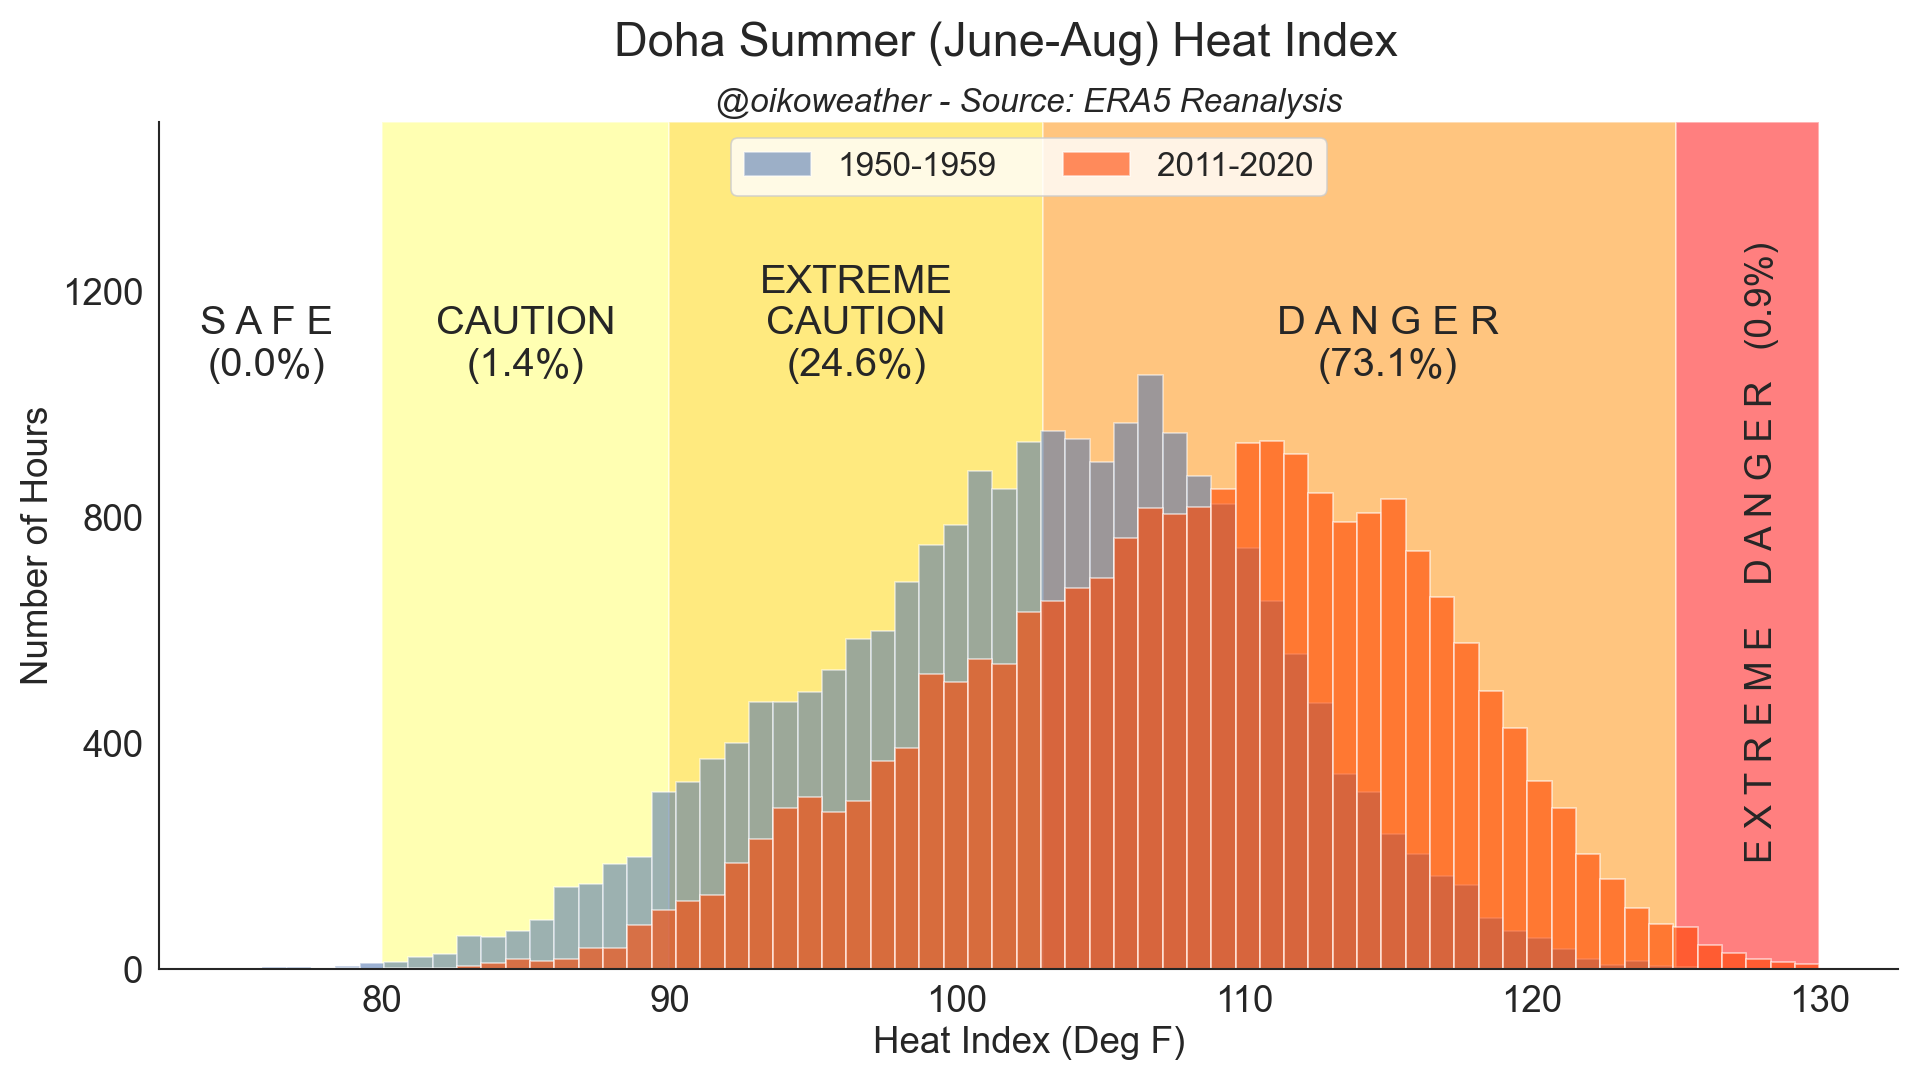
The scary thing about climate change for building designers might be that the future climate for the design life of buildings (30~50 years?) is really not predictable with any measure of reliability. NOAA recently released a new ‘30-year climate norm’ and even this concept of 30-year average weather is being challenged and perhaps rightly so. For instance, here’s the heat index change for Doha over the last 70 years that looks rather alarming:
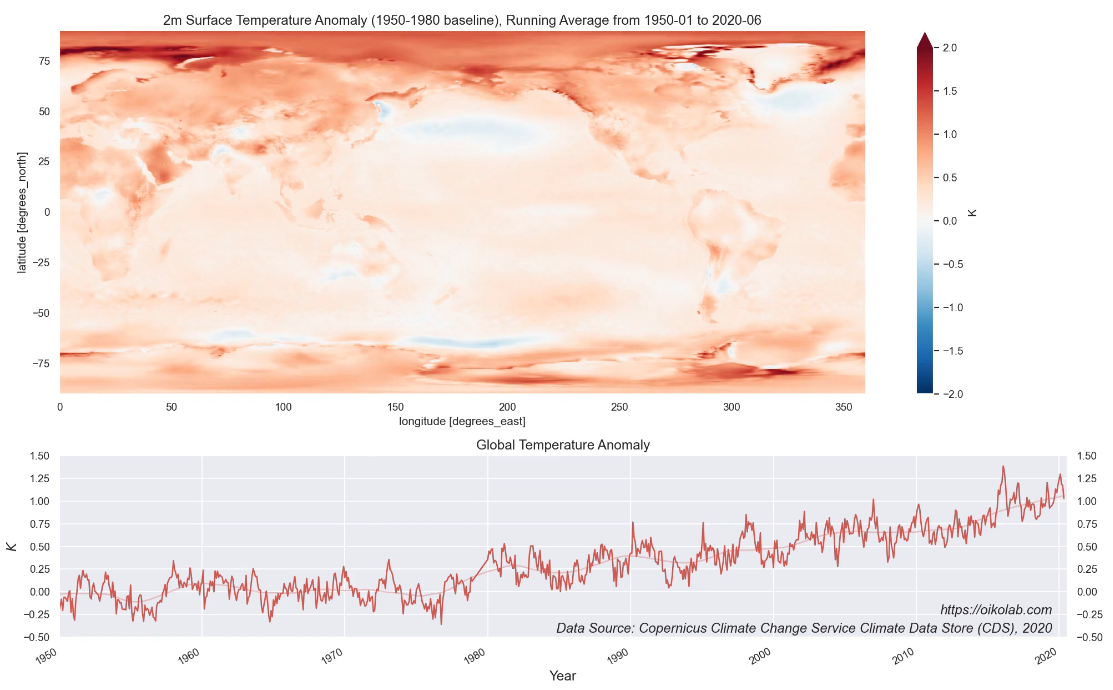
But this isn’t happening uniformly as you can see below and to complicate things more, there are seasonal variations in the changes too. For instance, if you meet someone from Alabama who doesn’t believe in global warming given their anecdotal experience, it’d actually be quite understandable.
To me, this indicates the urgent need to start calculating and representing the uncertainty associated with the simulation.
Currently, energy simulations output a single value which, in theory represents the average of some assumed probability distribution. Each input to the energy simulation also represents some average (our best guess) of some probability distribution. Infiltration values are a famous example, where modelers typically use a single value for an entire facade, which represents the average of many infiltration measurements from a representative building. From this perspective, the output of the model is really the average of all these implicit distributions: E[P(Energy | Inputs)] (probability of energy given some set of inputs).
If the output of the energy model is a probability distribution instead: P(Energy | Input), we now have a way to represent the uncertainty associated with our estimate, based on the uncertainties we assign to each of our inputs. As a modeler, you have a more sophisticated (and in my opinion, a more satisfying) way to build up your simulation, since you have a intuitive way to update your energy prediction based on new data (reduce the uncertainty of inputs as you move from concept, schematic onward), finally having a way to communicate/calculate tail risks, and, of course, incorporate different climate change conditions.
Of course, it’s hugely computationally expensive, but there are multiple ways of getting around that problem.
That would be a great approach. On the other hand, from my impression, it seems like this level of accuracy in weather data doesn’t seem to be terribly critical for building energy modellers.
Before looking to build a future weather file, a low-hanging fruit would be to keep TMYs at least up to date - if you look at the actual years that the EPW files are generated from, they tend to be outdated by about two decades. For example Boston (1978~2003), Shenzhen (1978~2000), Hong Kong (latest month is from 2003) etc. Trying to create future weather files from these without first updating these would be rather silly.
One explanation that I was told was that the weather file really only provides a baseline to compare different design options and given that average BEM model accuracy is only about 50% (per DoE), this is quite understandable even though it might not be ideal.
Yes, the BEM is just supposed to provide a baseline, but this doesn’t mean inaccuracy is acceptable. It’s just that the accuracy that is important just isn’t the same as accuracy between a model an actual building (which is what the 50% accuracy in that quote is referring to). There are two reasons for this:
The average accuracy for professional or experienced energy modelers is a lot higher then 50%, so there’s some amateur work dragging that number down.
It’s somewhat of an apples to oranges comparison[1]. The BEM isn’t really trying to model the actual building in operation, since we can’t realistically predict different weather conditions, occupant activities and so on.
So the BEM is meant to drive building design, and needs to be internally consistent and accurate within that space. It doesn’t need to match the actual building precisely, since that isn’t it’s objective.
But I agree it’s worth questioning whether more accuracy in weather data is worth more complexity. Off the top of my head, the one area where better climate data (be it future, up-to-date, or localized) would be useful, is accounting for the kind of extreme events that occur. Shifting the entire distribution of weather data would have an impact on mechanical sizing, unmet hours, and feasibility of some passive systems. As you have pointed out, this is complicated by the variance between local/airport weather, climate projections, and other conditions, but this is why I think a probabilistic approach, where uncertainty of inputs can be translated to uncertainty of outputs, is a straightforward way to handle it.
And on your second point, I agree updating TMY files is a no-brainer.
[1] Caveat: there are efforts to rerun the BEM with an AMY, and insert logged occupant activity, plug loads, (or alternatively normalize the output based on these conditions) to get an apples to apples comparison. Especially now with a lot of interest in creating “digital twins” for facilities management, and HVAC optimization. But this is not the typical use-case of BEMs, at this point.
Thanks for the clarifications - these are really good points.
Out of curiosity, do you know how prevalent the usage of TMYx files (Dru’s update of TMY based on 2004-2018 weather data hosted on Climate One Building)? I think these are quite important updates. I went through the 2000+ EPW files on EnergyPlus website (Weather Data | EnergyPlus) and the median value of the years seems to be around 1990, with the latest year being 2005’ish for most locations.
I have to admit I’ve never heard of TMYx before. I’m also not a professional building energy modeler so I don’t know if that generalizes beyond me, but in my experience I’ve only heard of and used TMY2, TMY3. The naming convention confuses me, what does the “x” stand for?
My impression was that after seeing TMY3 not get updated by NREL (their document is from 2008 - https://www.nrel.gov/docs/fy08osti/43156.pdf), Dru & Linda went ahead to create updated weather files in an unofficial capacity, since it might have to be up to NREL to call it TMY4 or something.
Since EPW format was originally created by Dru & Linda, it’s probably as official as it can get without the institutional backing. Given that the hottest 10 years have been in the last 15 years or so, I think the users of TMY2/3 should at least know how outdated the data is. Especially now that NOAA’s new climate normal covers 30 year period from 1991-2020, TMY2/3 files that include the years before 1990 should really be retired in an official way and discouraged from being used. In some other thread I mentioned how temperature in Paris exceeds 40C now on hottest days but Paris weather file still only peaks at 30C.
I would rather opt for using future climate data generated from climate scientists used in the IPCC’s. This is about as state-of the art we can get and it has been shown that climate projections up to about 2060 should be used. Further past that, the uncertainties begin to become something we shouldn’t consider accepting.
It has also been shown that at least for UWG (the Singapore case study), the location of the weather station does not make that big of a difference because the radiation data are the main drivers.
By the way, I am currently working on a probabilistic framework for this.
I would rather opt for using future climate data generated from climate scientists used in the IPCC’s. This is about as state-of the art we can get and it has been shown that climate projections up to about 2060 should be used. Further past that, the uncertainties begin to become something we shouldn’t consider accepting.
Interesting point. What’s the resolution of the IPCC future climate data? Is it available for specific geographic areas like ERA5 data? It seems like there are two sources of weather data uncertainty discussed in this thread: the time period of the weather data, and location of the weather data. The IPCC future data solves the first problem, but I’m not sure if it addresses the latter problem. ERA5 data solves the latter problem, and partially solves the first problem (using current data), but it doesn’t account for future climate change.
I’m not sure what the right trade-off is, but one thing is certain, the TMY format is the worst of both worlds, the data is out of date (i.e. from 1970s), and is derived from measurements at a weather station that may not be reflective of the actual building site.
It has also been shown that at least for UWG (the Singapore case study), the location of the weather station does not make that big of a difference because the radiation data are the main drivers.
If radiation is the main driver, we should still expect the interaction of the radiation with the thermal mass in the urban areas to play a role in the microclimatic conditions. In which case the rural/urban split of the weather station and analysis location still seems to play a role… Which study are you referring to?
By the way, I am currently working on a probabilistic framework for this.
If you use regional climate models, resolutions can get down to 12.5 x 12.5 km.
And regarding the weather stations, they provide only part of the input in the form of the EPW file. You are right that the thermal mass is very important but that comes into play through the XML file independent of the weather station as far as I understand. This is why the weather station doesn’t matter as long as it’s within the vicinity of the area you want to analyze. The paper is called “Computationally efficient prediction of canopy level urban air temperature at the neighbourhood scale” by Bueno.
Basically I am taking design criteria and design code in structural engineering and following those methodologies. It’s not gonna be easy but something like the philosophy behind LFRD.