Alright, you won me over. I realize that what we’re talking about here has no bearing on the monthly load balances that people typically create with Ladybug Tools since any heat that enters/leaves the mass of the exterior envelope within a given day is going to cancel out over a time period as long as a month.
But I can see how your suggestion makes single-day visualizations of the load a lot cleaner. For example, looking at the load profile over the summer design day, this is what we would have had previously when we counted the exterior constructions as part of the building:
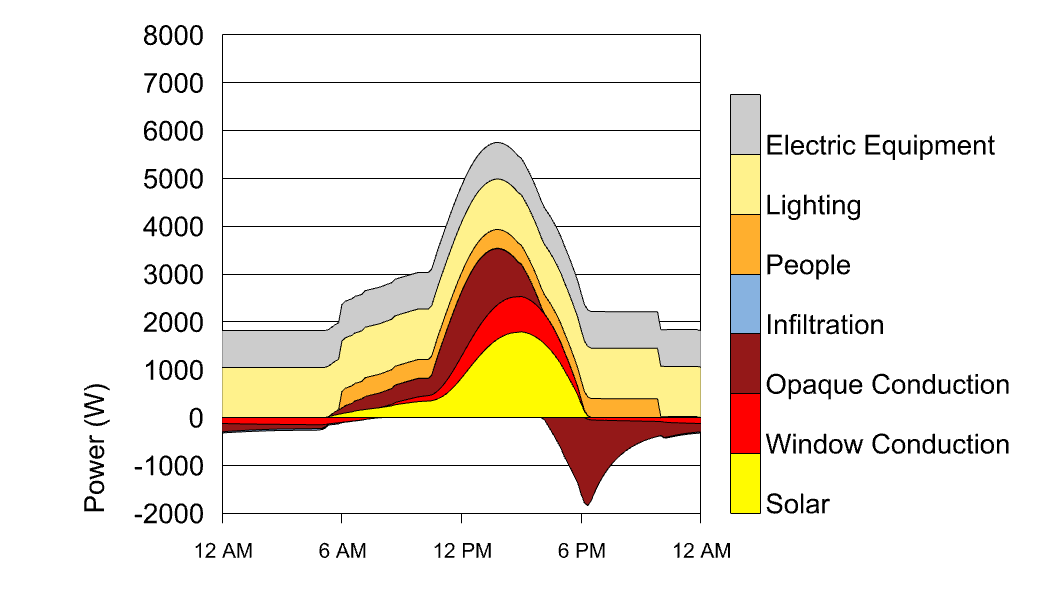
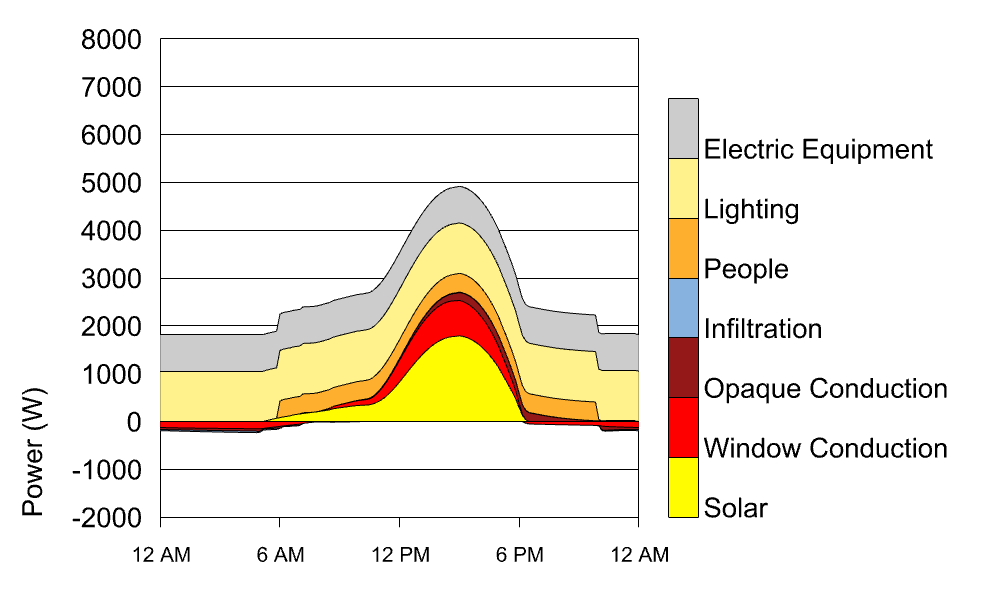
… and this is what we get if we discount the mass of the exterior constructions and only look at the heat that makes it to the interior:
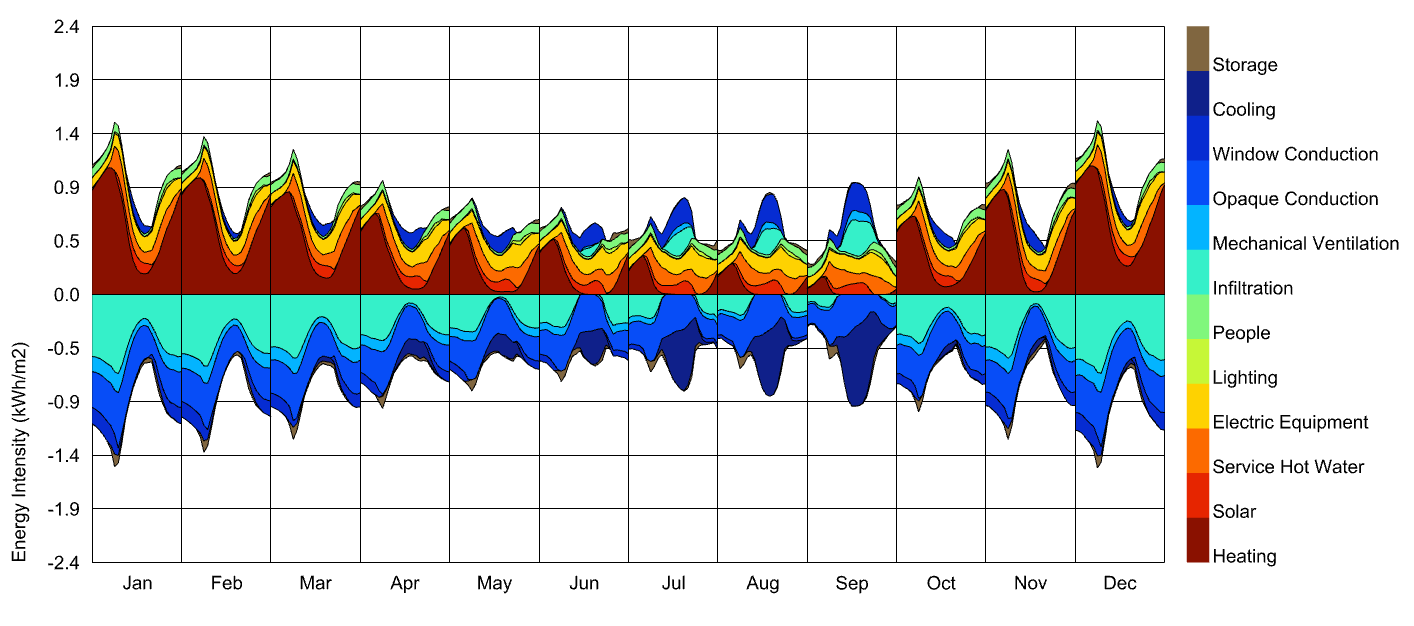
This also makes monthly-per-hour visualizations like the following more understandable:
I just merged the change is here and you can get it with the LB Versioner in an hour:
Thanks again for the suggestion.