Hi @daniatabka ,
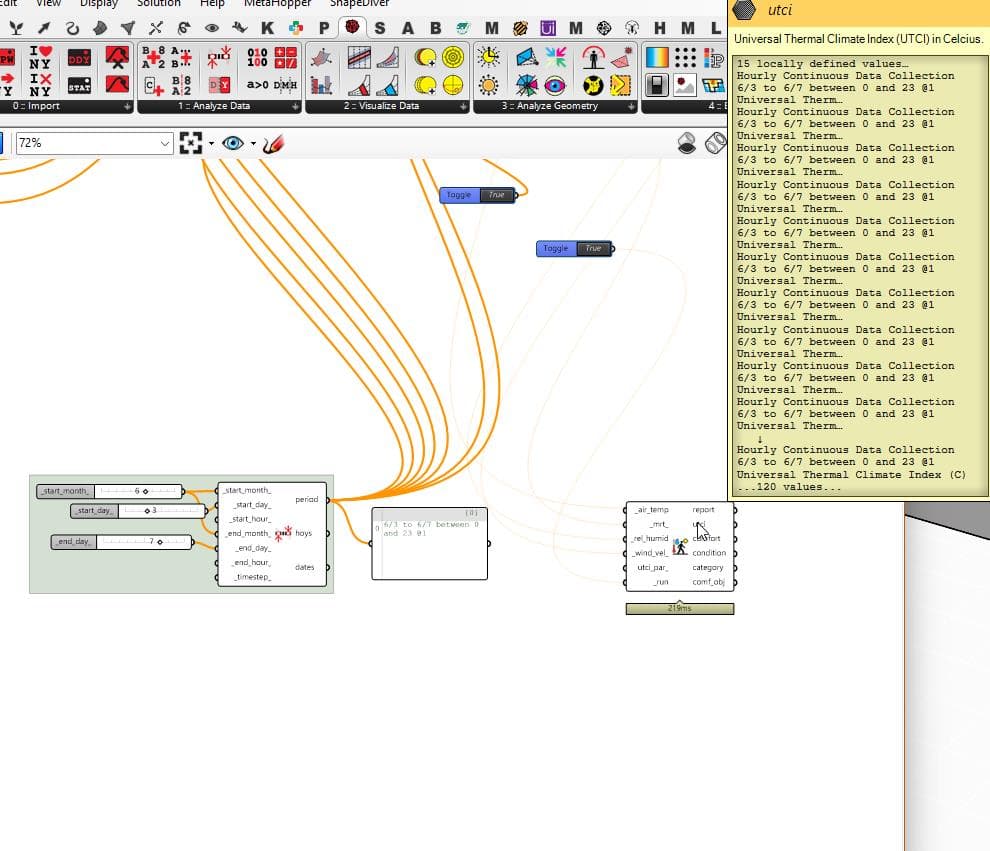
what I assume is happening here is that you are testing for a period (more than 1hr of the year). This will create a tree of outputs in your UTCI component which will represent a UTCI result for each point, for each step of the set period. (example screenshot below)
Depending on what you are after, you can post-process your results to either show a single step of the analysis, average of the period, or percentage satisfied - as a few examples.
Hope this is helpful