There is no problem in the file. The thing is that the period you choose is overheated (Air temperature).
UTCI comfort ranges between 9 to 26 C. The AT in the period you choose is way over this range.
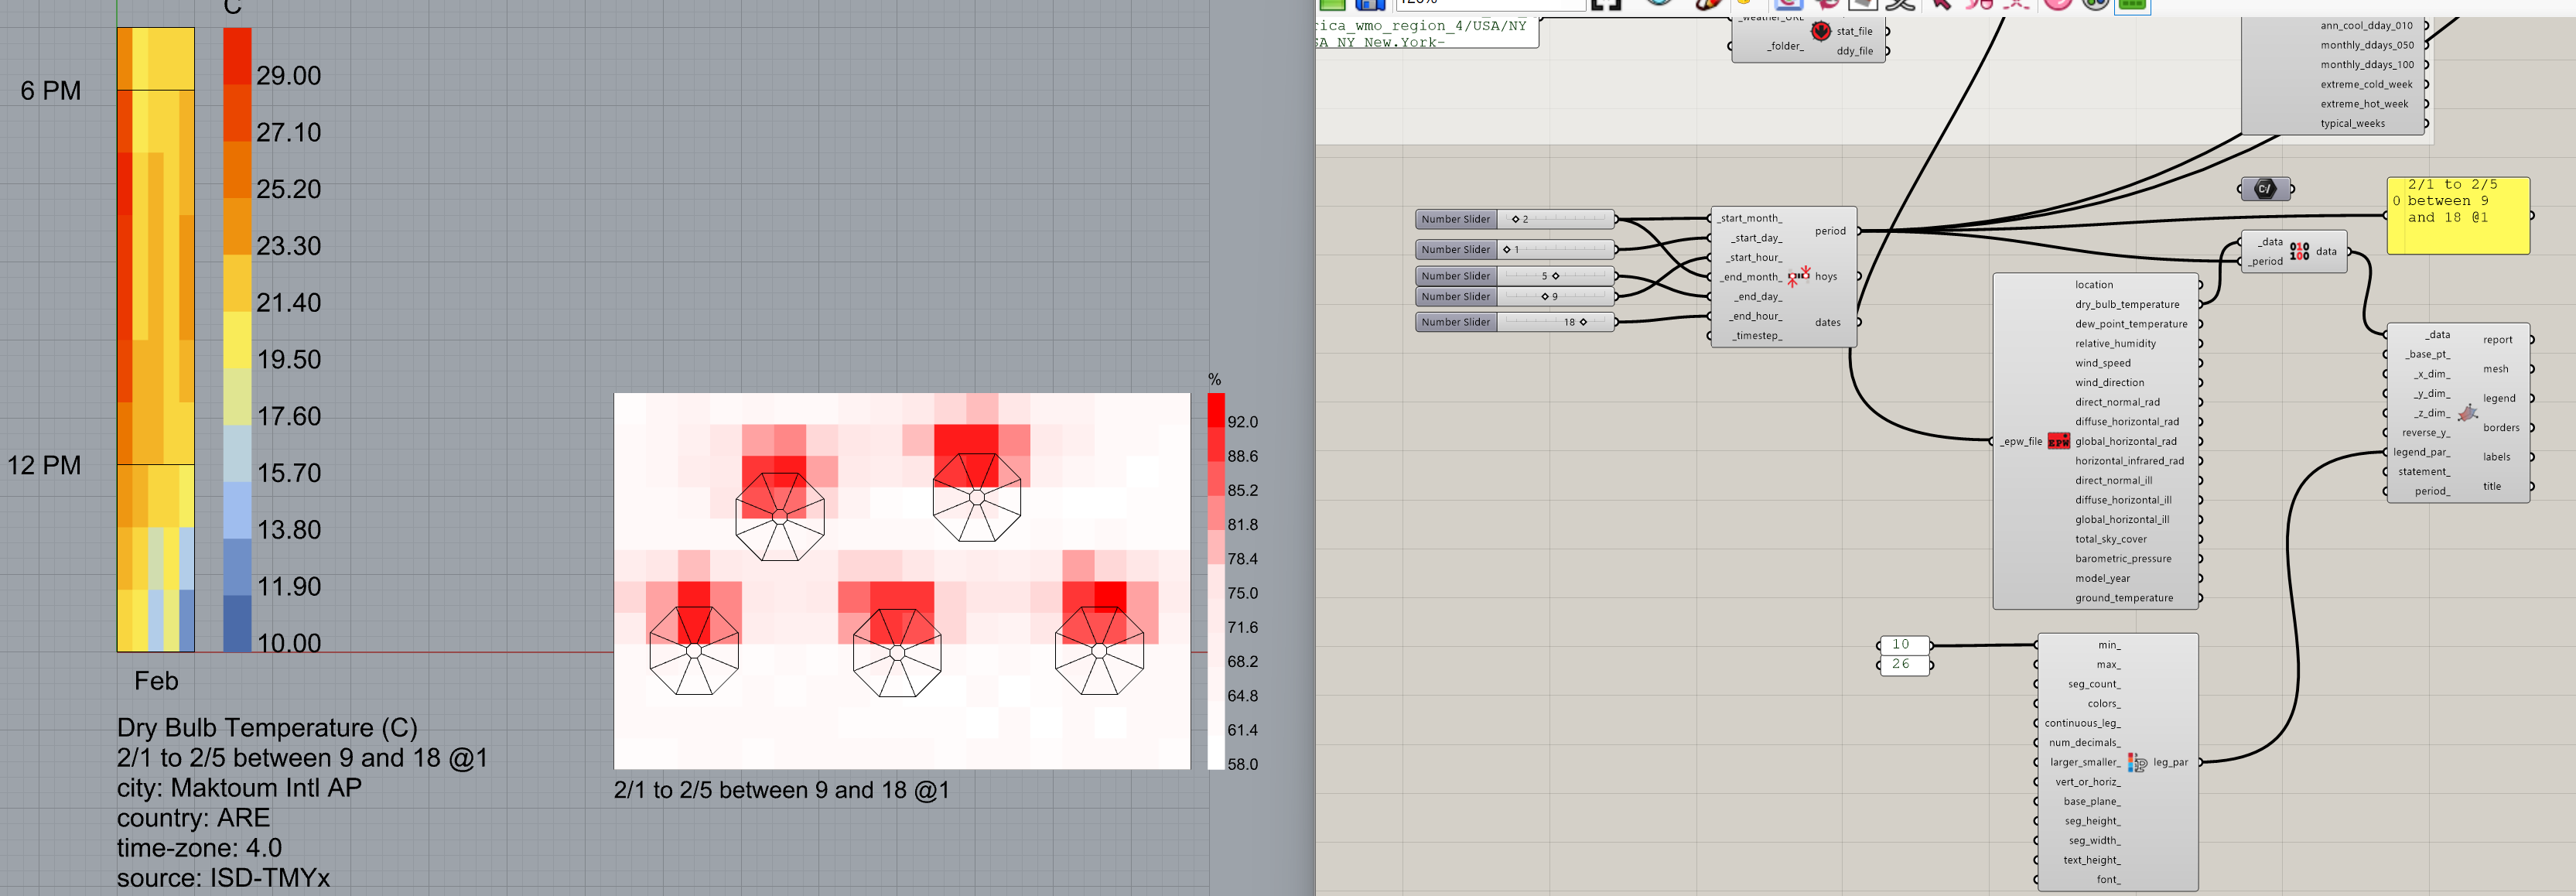
I picked a different period plotting the EPW AT data. In february, for your location, you can have comfort areas, like this:
And this is the working file:
outfoor_comfort_under_a_tree (1)_AY.gh (101.1 KB)
-A.