Rainfall Data Component

Great! Feel free to get in touch if any help needed.

2 Likes

Thanks for sharing this. I’ve always wanted a rainfall component within Ladybug and am eager to test your updated version when you finish it.

It makes me wonder, why doesn’t one already exist? Perhaps @mostapha knows of some limitations/issues that we can learn from.

@LelandCurtis and others,
I agree that this addition can be great.
Though i can say that the amount of trust you can give to this source is not always big. For my local climatic conditions i can say for sure the data is pretty much wrong.
So the lesson is to always have a double check of data 9any kind).
-A.

The reason that we don’t have such a component yet is because the values in weather file can’t really be trusted. There is a column in epw file for hourly precipitation but the data is all over the place. Here are other possible resources to use if we want to do a comparison between the data from the available sources.

Thanks for the development. To address the issue found by @seanmoo you can check for the folder and create it if it not exist. Something like this should work:

if not os.path.isdir('your directory'):    
    os.mkdir('your directory')

Actually, it would be good to have the different sources mentioned by @mostapha as alternative sources in the component. That would allow to choose the data source and make the comparison between them much easier.

I wonder how straightforward would be to get the data from these sources, any idea?
So far, the data from The National Center for Atmospheric Research is quite easy to query.

I’m a bit behind with the initial built of the component but I will push it through the weekend.

I have finally adapted the RainfallComponent.gh (459.4 KB)
to the Ladybug template. I think it would be good to get this first version done before exploring the other data sources mentioned above.

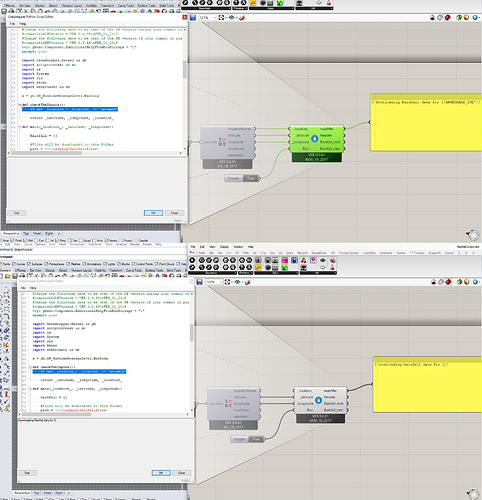
The only last part I still have to finish is the naming for the .csv file when the input location is not defined. For some reason this one is driving me crazy. I’m still trying to fully understand how to use the Input check function, lists and strings. So far, this is the closest I’ve got:

I’m no very happy with it (still a bit crappy), hopefully someone can through some light on this.
1 Like

@RafaelA,
Thank you very much for adding this component and it’s working very well on my system. This will be a very useful addition to the plugin and I only have one request before we merge it into the code base.

At the moment, I have to add the Ladybug header myself in order to get the data from your component to work with other Ladybug components like the Monthly Bar chart:


PrecipitationDataOnMonthlyChart.gh (485.9 KB)

It would be very useful to have the header included on the data when it comes in so that we don’t have to go through this extra step and we can just use the “separate data” component if we need to get just the numerical data again. If you include the header on the data, this also saves us from needing the Header output, which will make the component a little cleaner. Let me know if you agree, if so, feel free to make the change and send a pull request to the Ladybug Github.

Lastly, I agree that we should just merge in this monthly rainfall component for now but I will say that there is a way to get hourly precipitation data from the same NOAA source. Notably, this NOAA source is not a ground-based precipitation measurement but comes from analysis of weather satellite data, which have results for every 30 minutes over the planet (you can see in the GPM database here that the resolution goes down to 30 minutes at every 0.1 degree of latitude/longitude). The derivation of the data from satellites makes it much more accurate than the epw precipitation data, which comes from a human measuring a rain gauge by eye.

You have to request the specific GPM data that you are interested in (year and location) because it’s a huge database so the process of getting the data can take a day or two. Still, having this data would be very useful for modeling things like flooding in big rain events and I had always planned to build some components that bring this data into GH. If anyone wants to tackle this task, we will definitely merge the results into the Ladybug Tools code base.

-Chris

Many thanks for the notes @chris, it makes a lot of sense! Somehow it hadn’t crossed my mind.

I have updated the component (20171128_Rainfall.gh (507.0 KB)) to incorporate the headers, but there is still something beyond my understanding - Although Ladybug’s header component and this one generate the same data, the Monthly Bar Chart doesn’t accept the output of the Rainfall component as a valid input. The error is:

Current document units is in Meters
Conversion to Meters will be applied = 1.000
Runtime error (TypeErrorException): unsupported operand type(s) for -: ‘str’ and ‘int’
Traceback:
line 299, in makeChartCrvs, “”
line 1135, in main, “”
line 1203, in script

So far, I have compared the data types coming out of both components, using print(type(Rainfall_mm[8])). All the items in both lists are equally strings so I can’t see any reason for it not to work. I guess it may have something to do with python data types - still a starter on that side. If someone has a hint on this, I should have it soon and make the pull request :slight_smile:

Regarding the GPM database from NOAA, it looks very accurate and complete. I guess that bringing that data into grasshopper would open a whole new set of capabilities - flooding simulations sounds a great use of this data. As much as I would like to embark on it, I’m still learning the basics of python and it seems a huge task to take on. In any case, I’m keen to keep exploring it and try to find some time push it forward (it is difficult to know to which extent) - Would it be better to open a Github topic for this?

@RafaelA ,
I haven’t had time to check your file but I’m pretty sure that I know what the issue is: the dates on the header need to be real python tuples and not just strings (so they should be (1,1,1) and not “(1,1,1)”). Try making them as python objects and it should hopefully work. The use of these tuples was a less-than-ideal design decision that will be corrected in Ladybug+. I’ll respond about the GPM database once I get the chance.

That’s it @chris! Now it should be working perfectly :smiley: 20171128_Rainfall.gh (503.6 KB)

1 Like

@RafaelA,
Would you like to contribute this component to the Ladybug Legacy tool set? If yes, can you please send a pull request on Github? I can help you if you need any help in this process.

Hi @devang,

Of course!
I do have a Github account, but I really have no idea on how to send a pull request - thanks for your help

Thanks @RafaelA,

  1. You need to fork this repository
  2. Clone your fork on your machine using Github desktop
  3. Once that’s done, the next steps you can follow from this video. The video will start at a relevant time.
  4. Once you make a pull request, Mostapha or Chris will review it and will issue comments if any.
    Let me know if you have questions at any point in the process.
1 Like

Hi every one.
I got this error when I tried run component.
Could you help me plz?


RainfallComponent.gh (464.3 KB)

I think that is a problem with the connection between the page where the data is extracted and the component. But I don’t know how to repair it either. @devang Is it going to be repaired?

1 Like

Same here, the link between the data set online and GH is broken, I will investigate

Runtime error (WebException): The remote server returned an error: (404) Not Found.

Traceback:
line 91, in main, “”
line 156, in script
We will have to find another way

2 Likes

Hi Chris,

I know this was a long time ago when a solution was found, I am fairly new to Rhino and am struggling with pulling the monthly rainwater data from the EPW as shown in your solution. Has there been an updated solution found yet, or even if you could point me in the right direction to how to resolve this?

I am receiving this message - 1. Solution exception:An exception occurred during a WebClient request.

Please let me know if the solution still works, as I potentially have done something wrong on my end?

1 Like

Is there an updated tutorial somewhere for how to download this as a component into grasshopper for use? I am new to grasshopper and have no idea how to edit the python script or anything…

I have just updated the Python component and attached a GH file with LB 1.6.0 components. Main change:

update line 53 with:

“url = ‘https://tds.gisclimatechange.ucar.edu/ar5/?requestType=plotData&latitude=‘+a+’&longitude=‘+b+’&variable=ppt&plotType=monthlyAverage&rcp=26&year=2016&download=true’”

Rainfall.gh (13.9 KB)

Thanks for the work @RafaelA :slight_smile:

@cdlea @KHollywood @Alakelele @estebanar1997 @hossein_nazari

2 Likes