I am a new user and just still learning Ladybug Tools.
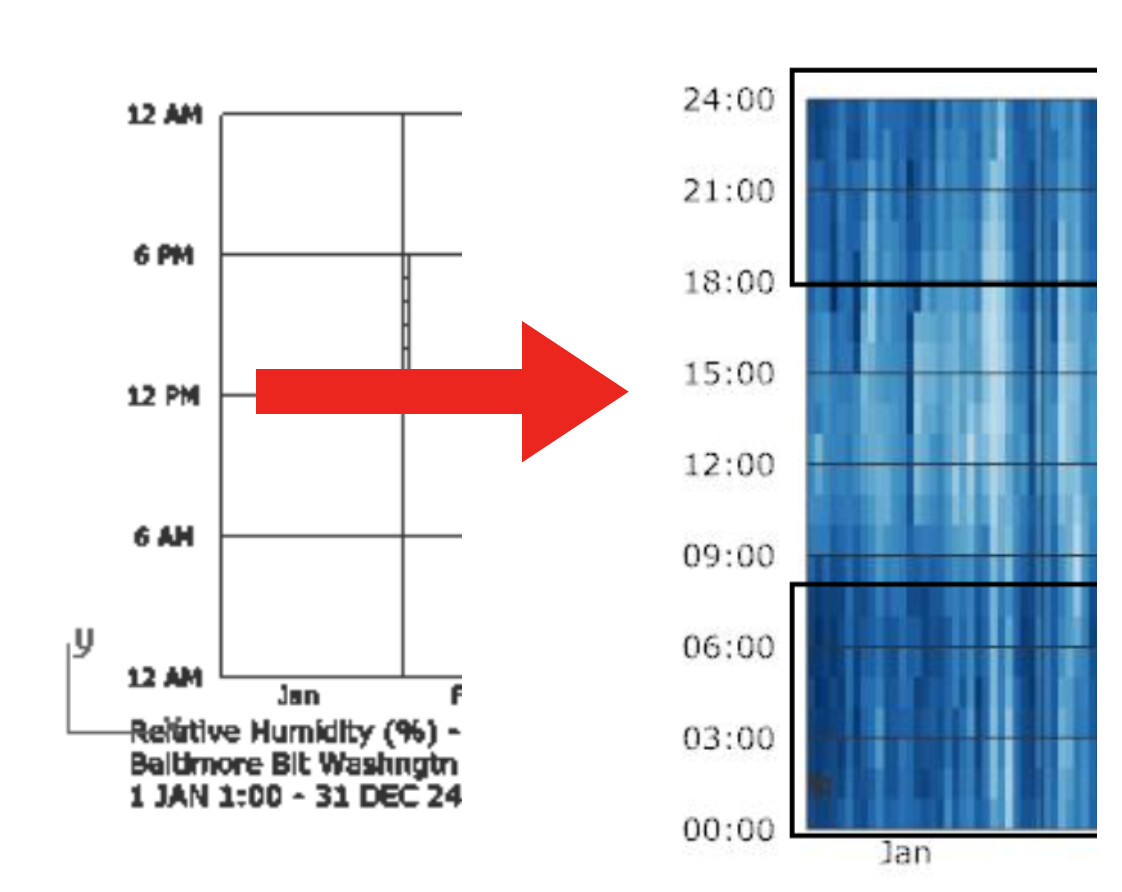
I’ve reviewed the form, but haven’t found the answer to my question. My interest is how can I change the weather file result graph from 12h scale to 24h scale from the beginning? I’ve found how this can be done later by Rhino performing a “bake”, but that means it has to be done for each calculation result.
Hi @Andris ,
You can do this two ways:
- Use some native Grasshopper components like “Text Tag 3D” to generate your own text from the outputs of the chart. For example, you can use the end points of the lines as your text base points and then plug in your custom text.
OR - Change the
hour_plot.hour_labelsvariable that is on this line of code inside the component to be equal to the following:
['0:00', '6:00', '12:00', '18:00', '24:00']
If this becomes a big enough pain point for people, maybe we can expose an option for this. But the two methods above seem simple enough to implement that it doesn’t feel critical.
2 Likes
Thanks @chris for the reply! I tried option B, but unfortunately I didn’t get it. I don’t know exactly where to put the text. I tried several options, but none work.
I would be very grateful for any further advice.
Andris
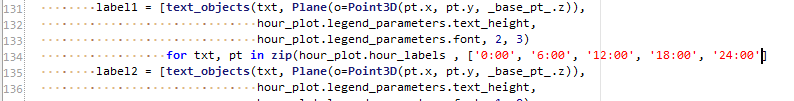
You need to replace hour_plot.hour_labels with ['0:00', '6:00', '12:00', '18:00', '24:00']
-A.
2 Likes
 Thank’s