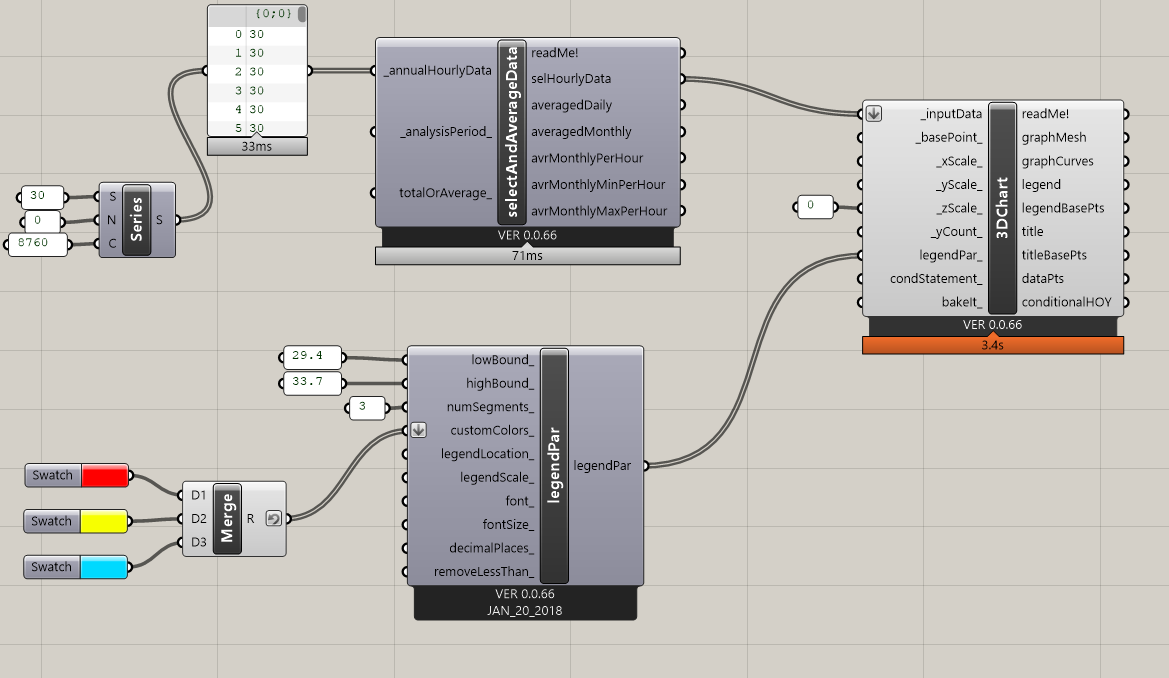
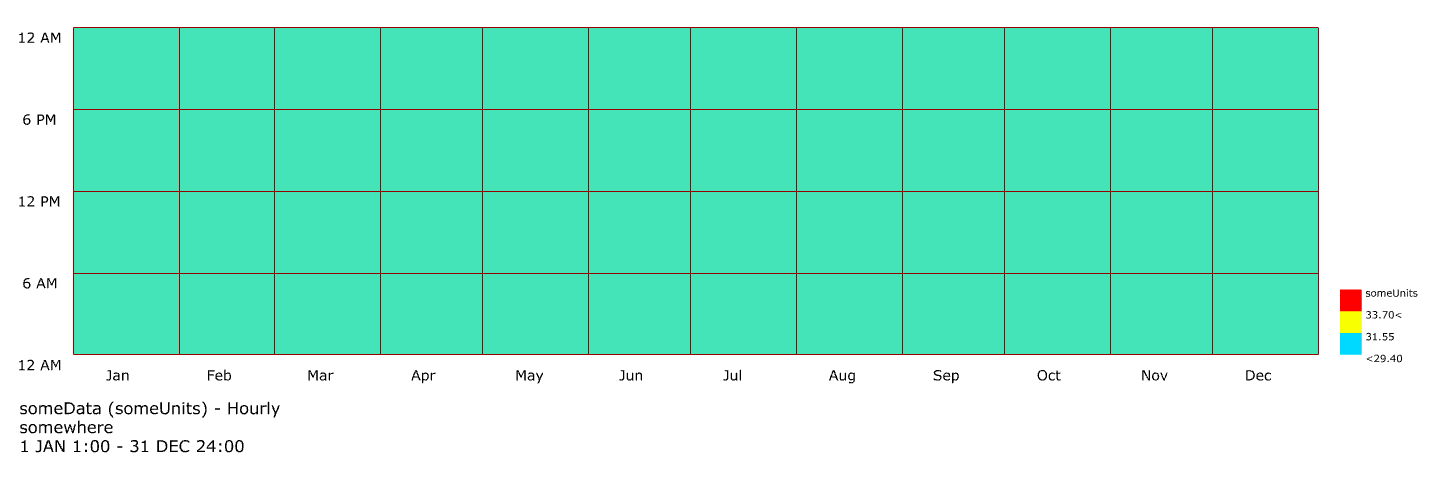
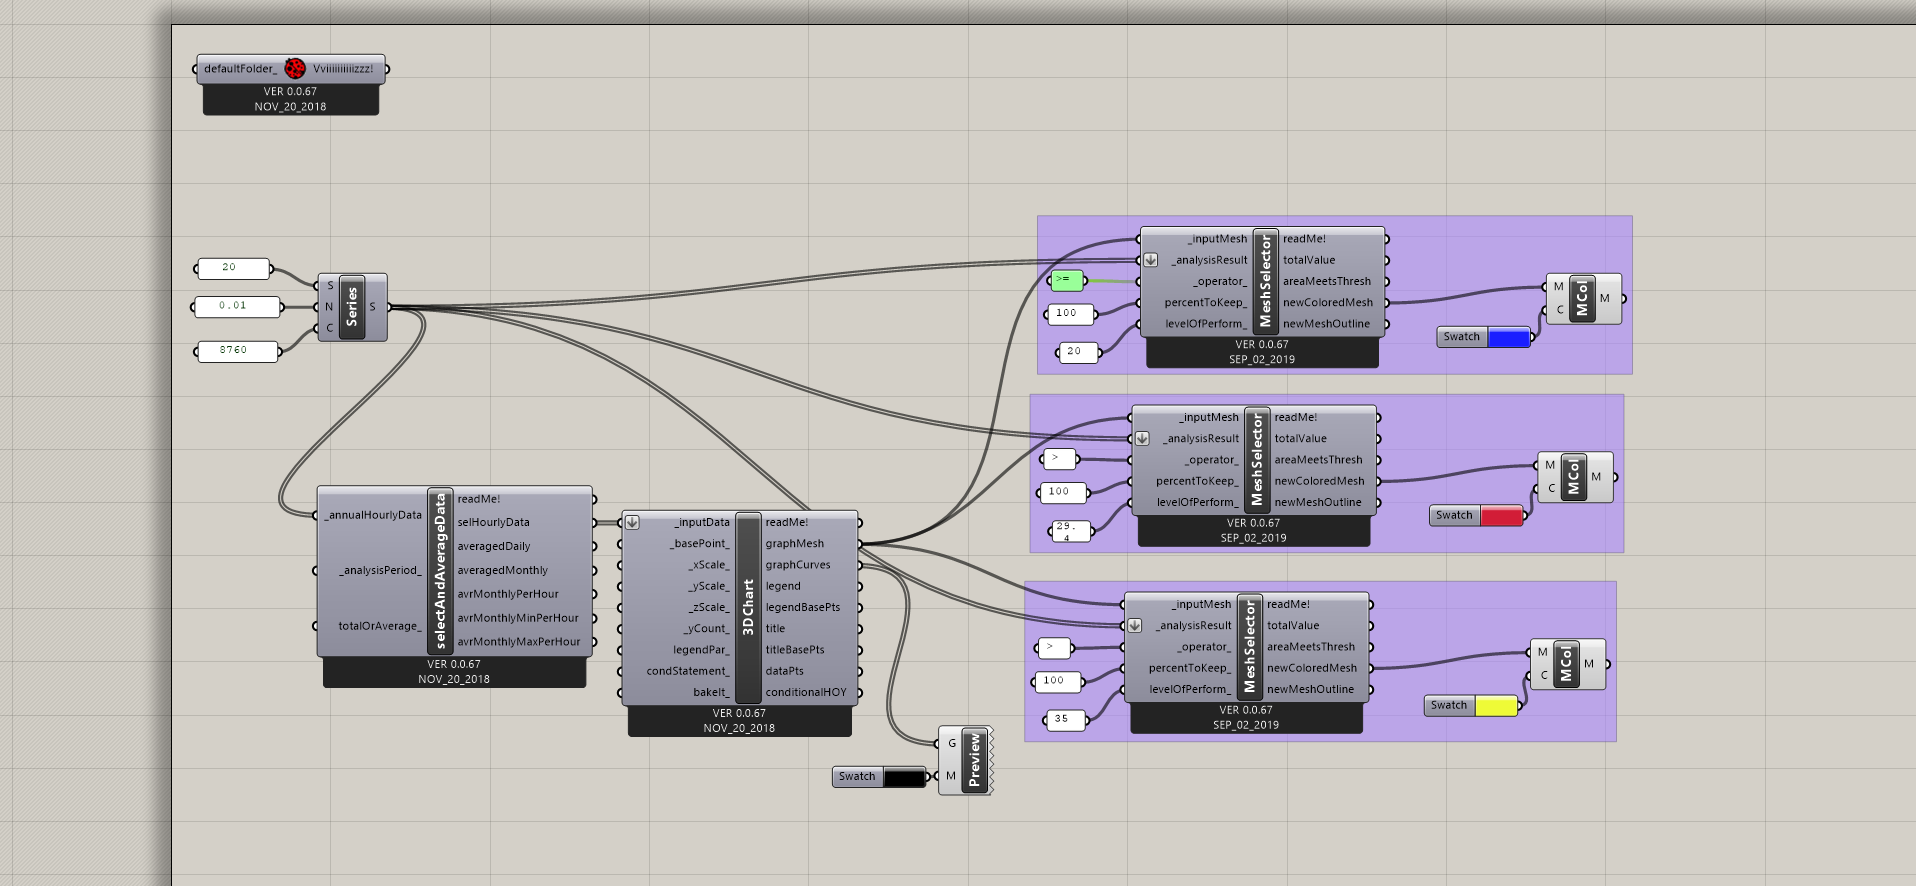
I have a very simple task. I want a legend with 3 colours only, say blue yellow and red. However when I plot say 30, it shows me a green colour. Can anyone help fix this.
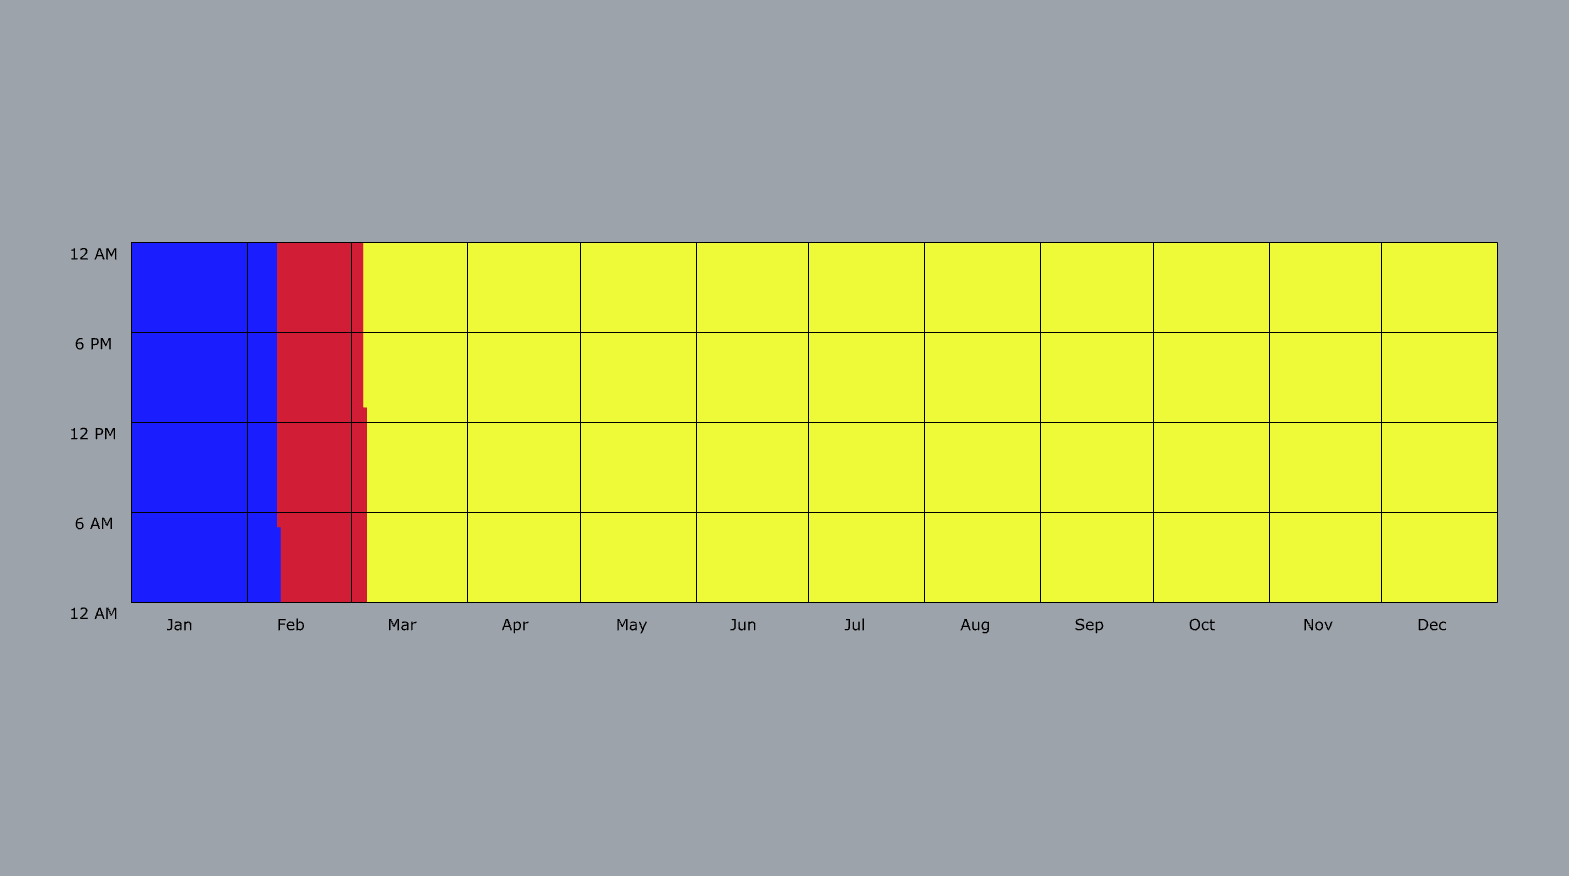
graph when I use 30
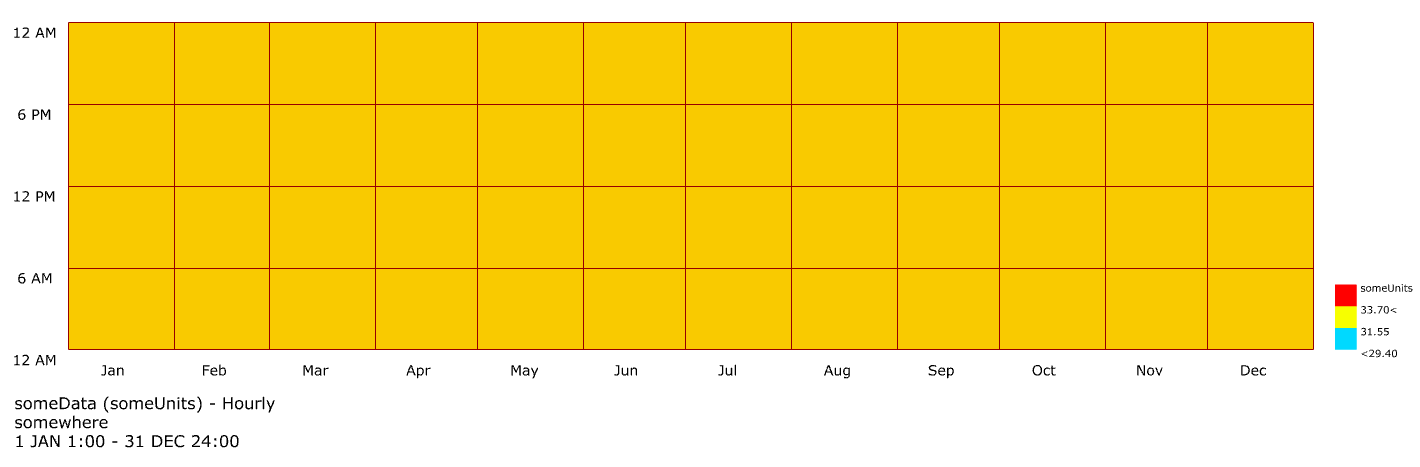
graph when I use 32
It seems like for numbers in between it is trying to interpolate the colour.
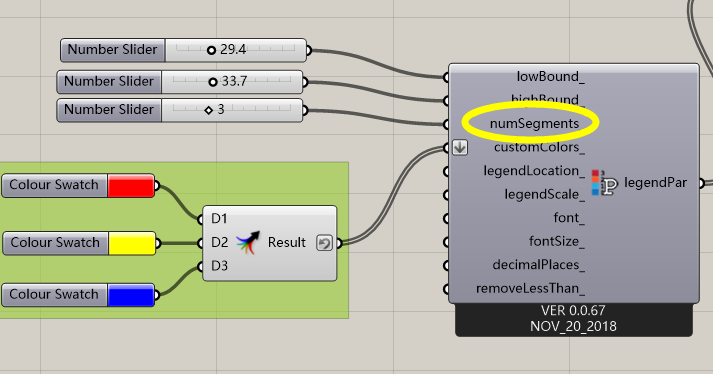
@SaketSarupria Pleast try to set numSegments as 3.
Its set to 3 only in my screenshot. unless the panel and slider makes a difference.
gh file3D Chart.gh (389.4 KB)
@mostapha @devang any input? Does the component automatically populates the gradient or should ideally be fixed colours. Thanks.
gogog
December 4, 2019, 5:00am
6
hi, @SaketSarupria
many thanks for the suggestion. I will look into it.