Thank you @sarith and @mostapha for your replies !
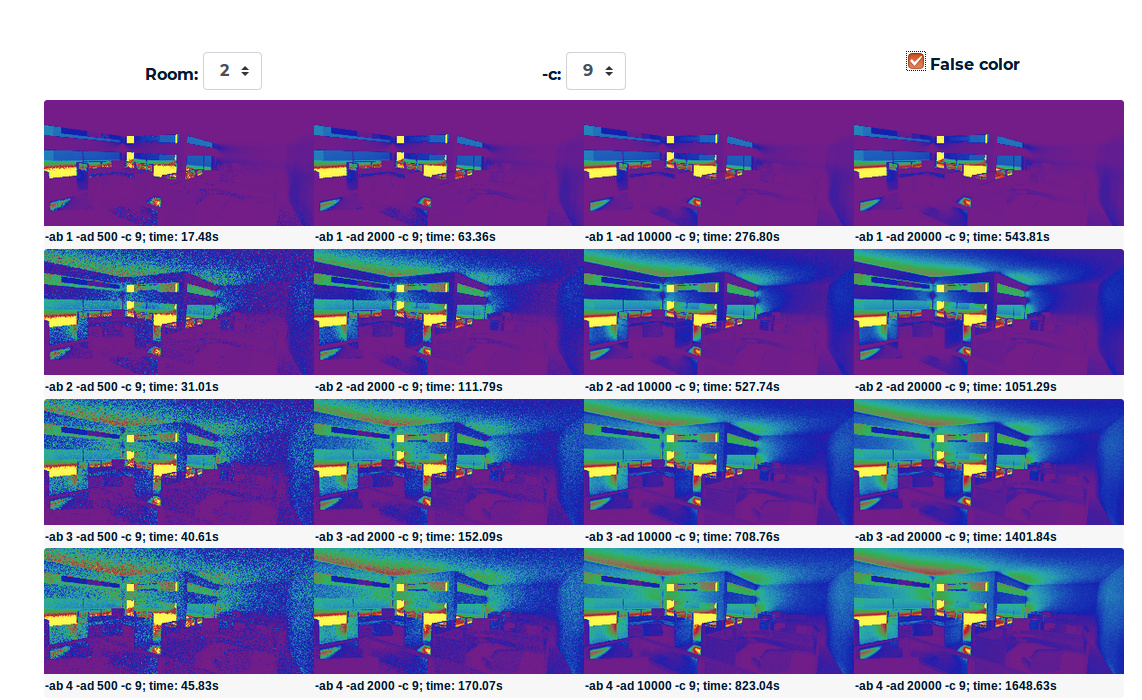
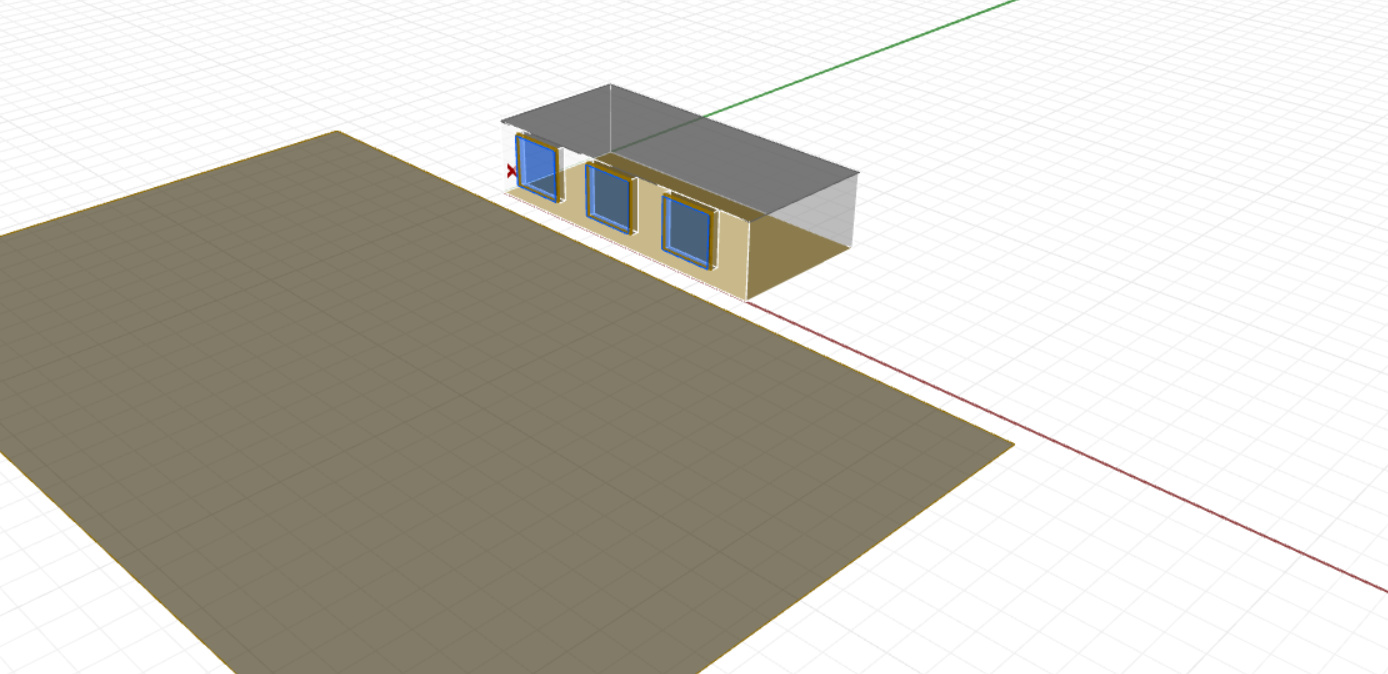
Finally got around to this and started off by doing the convergence test as suggested. The office example chosen for selecting Radiance Parameters looks as follows
---------------------------------------------------Convergence---------------------------------------------------
Altered the approach a little bit, running three 5PM runs at each Radiance parameter step. And instead of comparing differences between runs with different Radiance parameters, I compared the three runs with the same Radiance parameters to each other. Reasoning being that the first two runs I did with different, around medium quality, Radiance parameters gave fairly similar results by random.
To quantify the differences between the three runs I compared all 8760x168 measurements between each of the three runs to each other. This was done by subtracting all 8760x168 measurements, between each run with each other, and taking the absolute difference, resulting in three 8760x168 “absolute difference” matrices. Then looking at the maximum difference for each of the three matrices and the average difference, resulting in three maximum differences values and three average differences values. Lastly averaging the three maximum differences (AM) and similarly the average of three average differences (AA). If it makes more sence in mathematical terms:
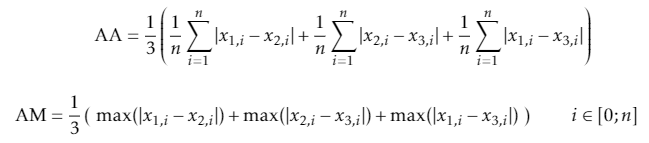
(n = 8760x168)
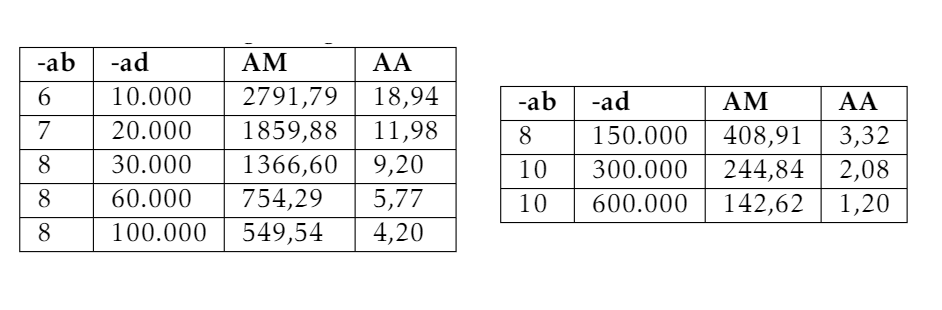
Results as follows:
Rest of parameters of V-matrix set to qual = 2 and D-matrix to qual = 0.
---------------------------------------------------Fidelity---------------------------------------------------
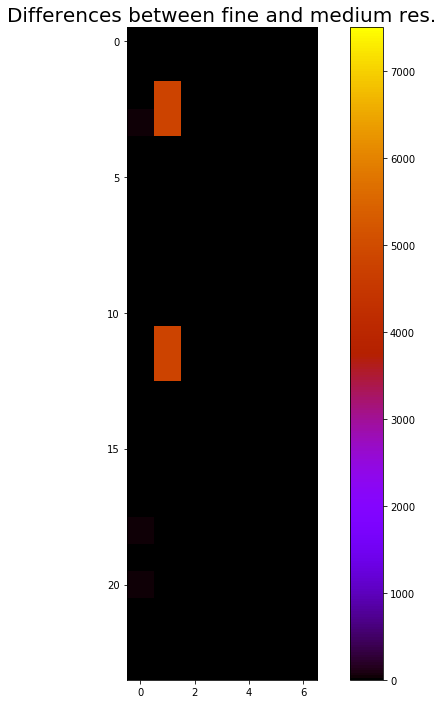
Chose 21. of June at 12. Trying first a Point In Time (PIT) simulation with -ab=10 and -ad=300.000 (called medium res.) and then -ab=12 and -ad=1.000.000 (called fine res.). First odd thing that stands out is that the two PIT simulations has differences between them:
(Plan view, windows to the left)
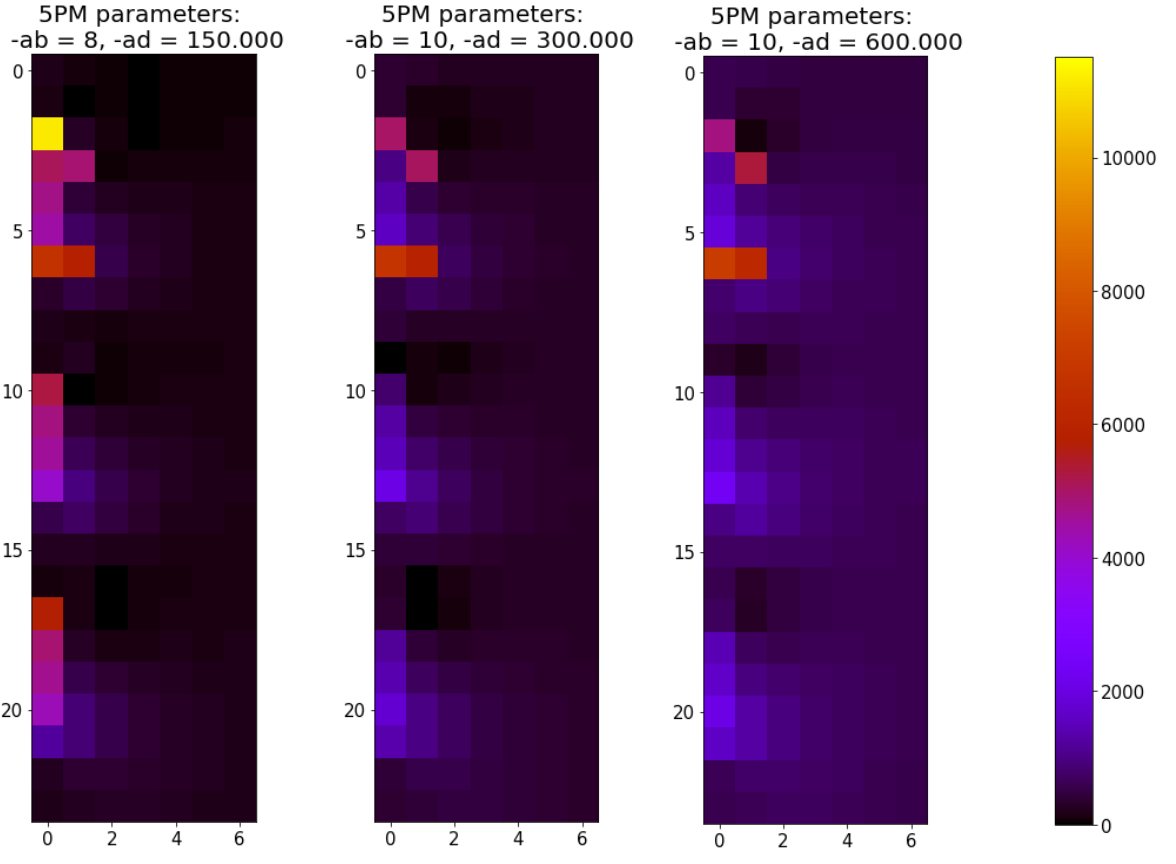
When comparing the PIT simulations with the 5PM runs, similar metrics as above was used (only difference n=168). Still performing 3 runs for each 5PM Radiance parameter setup, got following results:
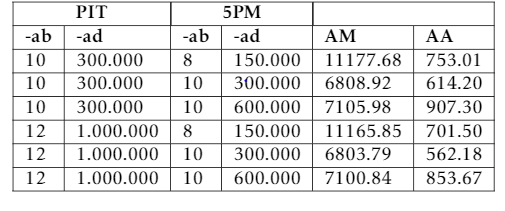
Quite big differences. When plotting the differences between the Fine res. PIT and the 5PM runs:
Interestingly the differences between 5PM and PIT become worse when dialing up the 5PM -ad from 300.000 to 600.000.
---------------------------------------------------BSDF resolution---------------------------------------------------
My motivation for using the 5PM (compared to DC) is because I’m running a parametric study, with currently 6 different IGU systems for each geometry.
The BSDF files used has the resolution of Klems (145x145 patches). Building on @mostapha comment and this article by Greg Ward ward-2011-var-res-bsdf.pdf (1.2 MB) I think the above differences between 5PM and PIT could be mitigated by a higher resolution BSDF, which I am currently developing for each IGU.
At final a question:
Building on this how does DC handle BSDF different from 5PM (T-matrix) ?
Any other comments or suggestions are highly appreciated