Thank you so much @mikkel and @chris , I think it’s working now!
GB_Radiation_Analysis_220405-01.gh (41.4 KB)
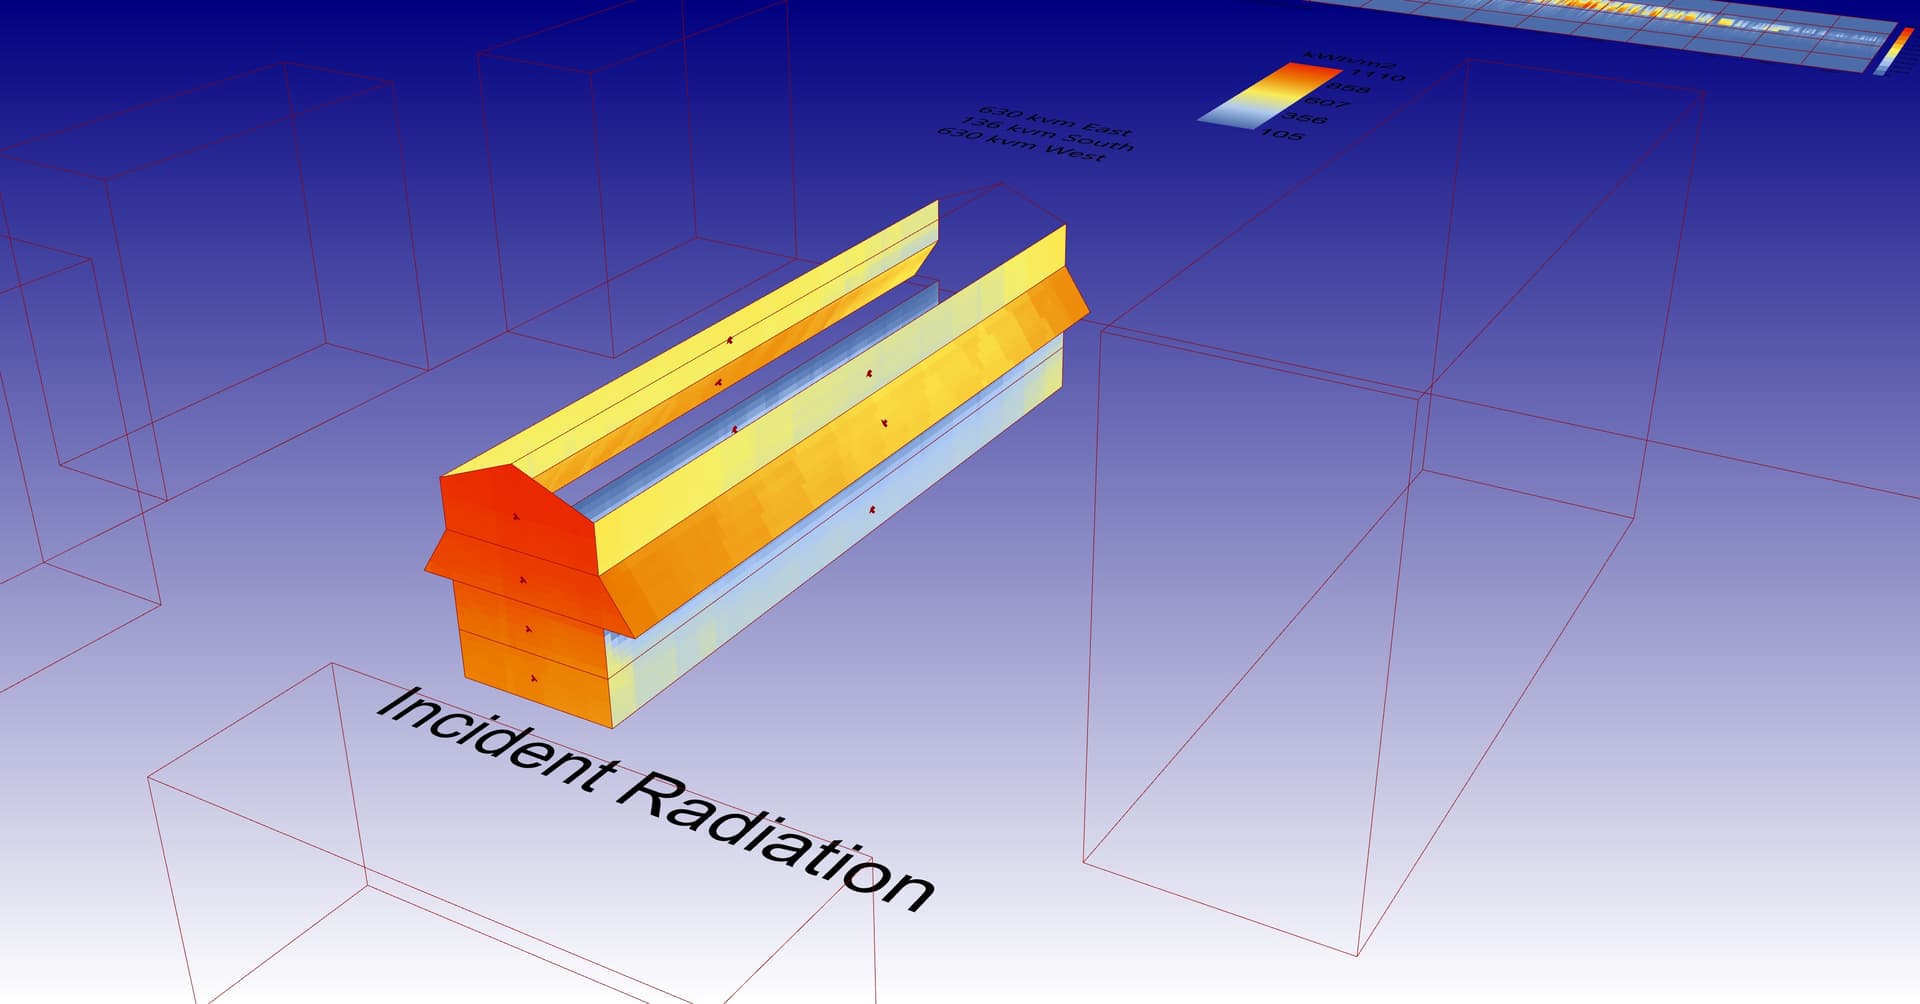
Why do I get very different radiation numbers when I run the the same surfaces through LB_Incident_Radiation (Total:774163kWh/y) and HB_Annual_Irradiance (Radiation: 7253kWh/y)?
My model is in mm and I’m running 1.4.0/1.4.2
It looks like this is probably what’s causing you to mis-calculate the total radiation from at least one of your two simulations. Are you dividing the Radiation in kWh/m2 by the area of your surfaces in square meters? Or are you dividing it by the area of your surfaces in square millimeters?
I haven’t done any math in the outputs from the two components…so the two should both show the total irradiance received on the facades….or have I misunderstood the two outputs?
Then you are not looking at total radiation energy out of the HB_Annual_Irradiance component since that component does not output energy in kWh. It only outputs the energy flux in kWh/m2. So you would need to multiply that value by the area of your surface to turn it into energy and compare it to the output from the LB_Incident_Radiation component.
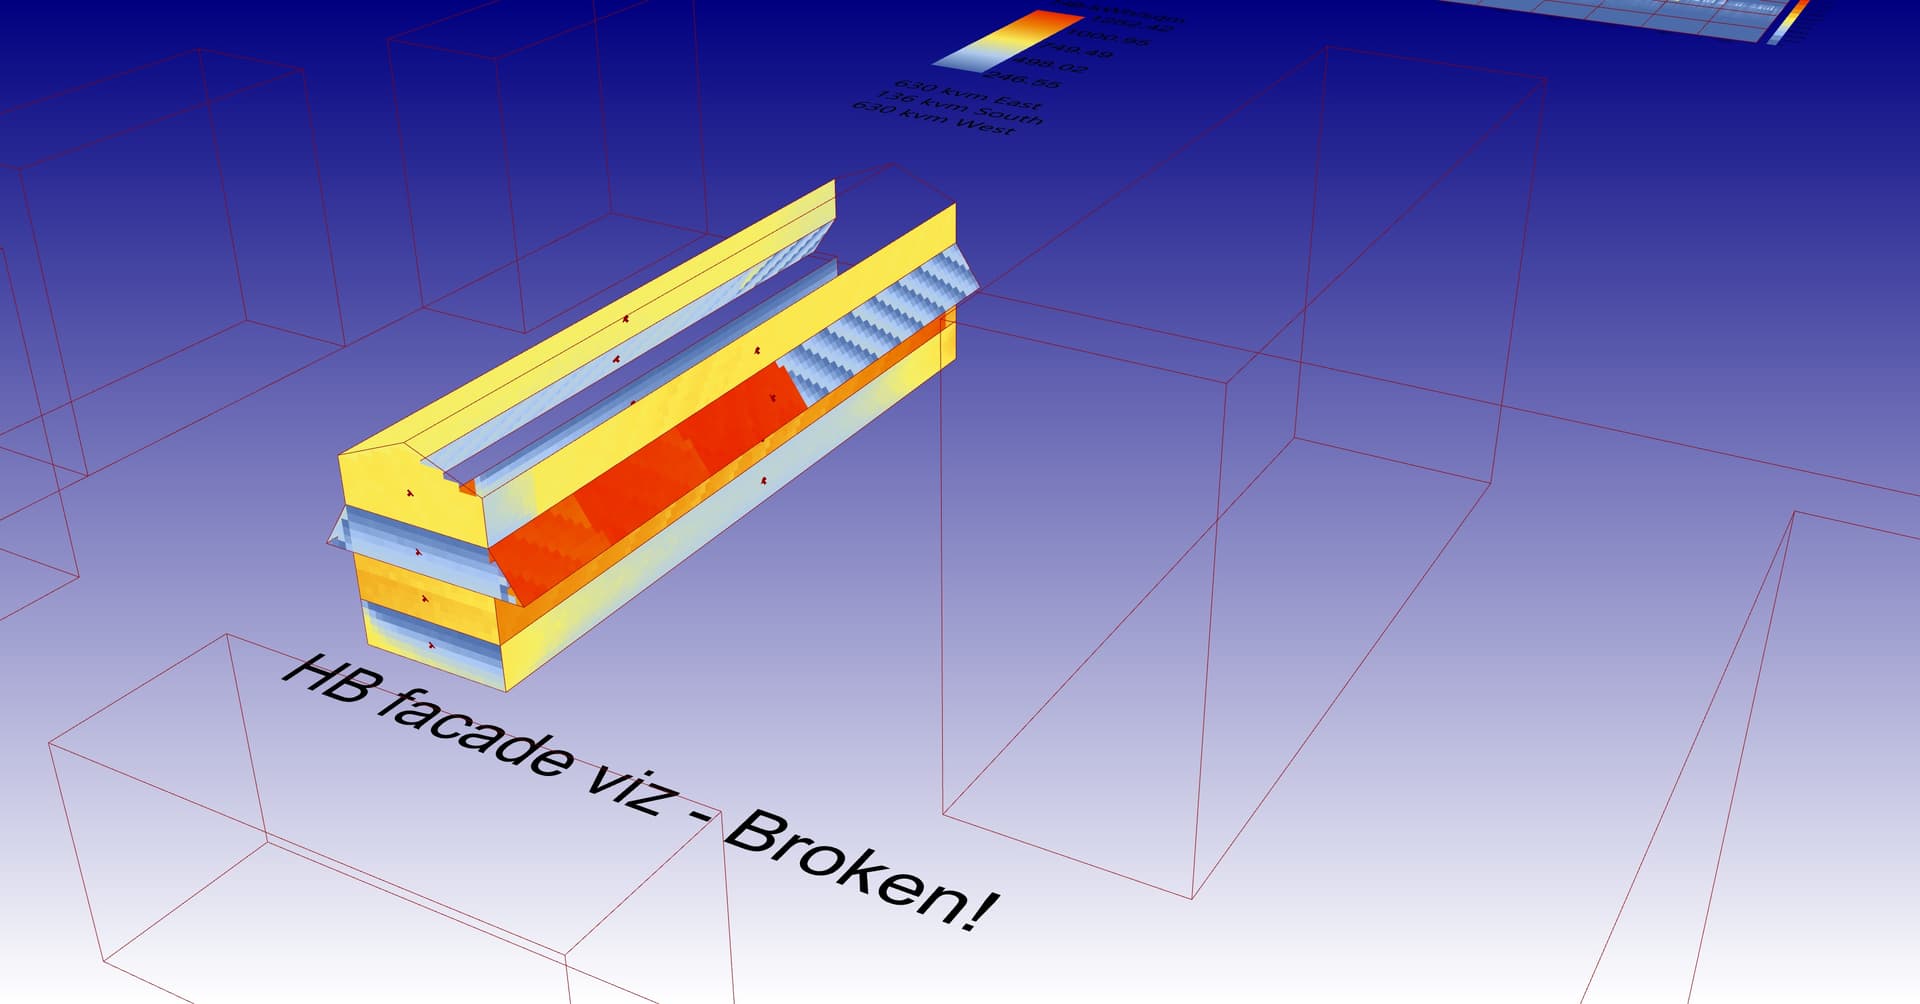
Thanks @chris …It’s still quite a bit off and the HB visualization on the building is really messed up relative to the LB version. It makes me a little nervous as to the data generated in my 8760 outputs.

All of this is in preparation for generating a 8760 dataset of a complex facade with panels arrranged like this.
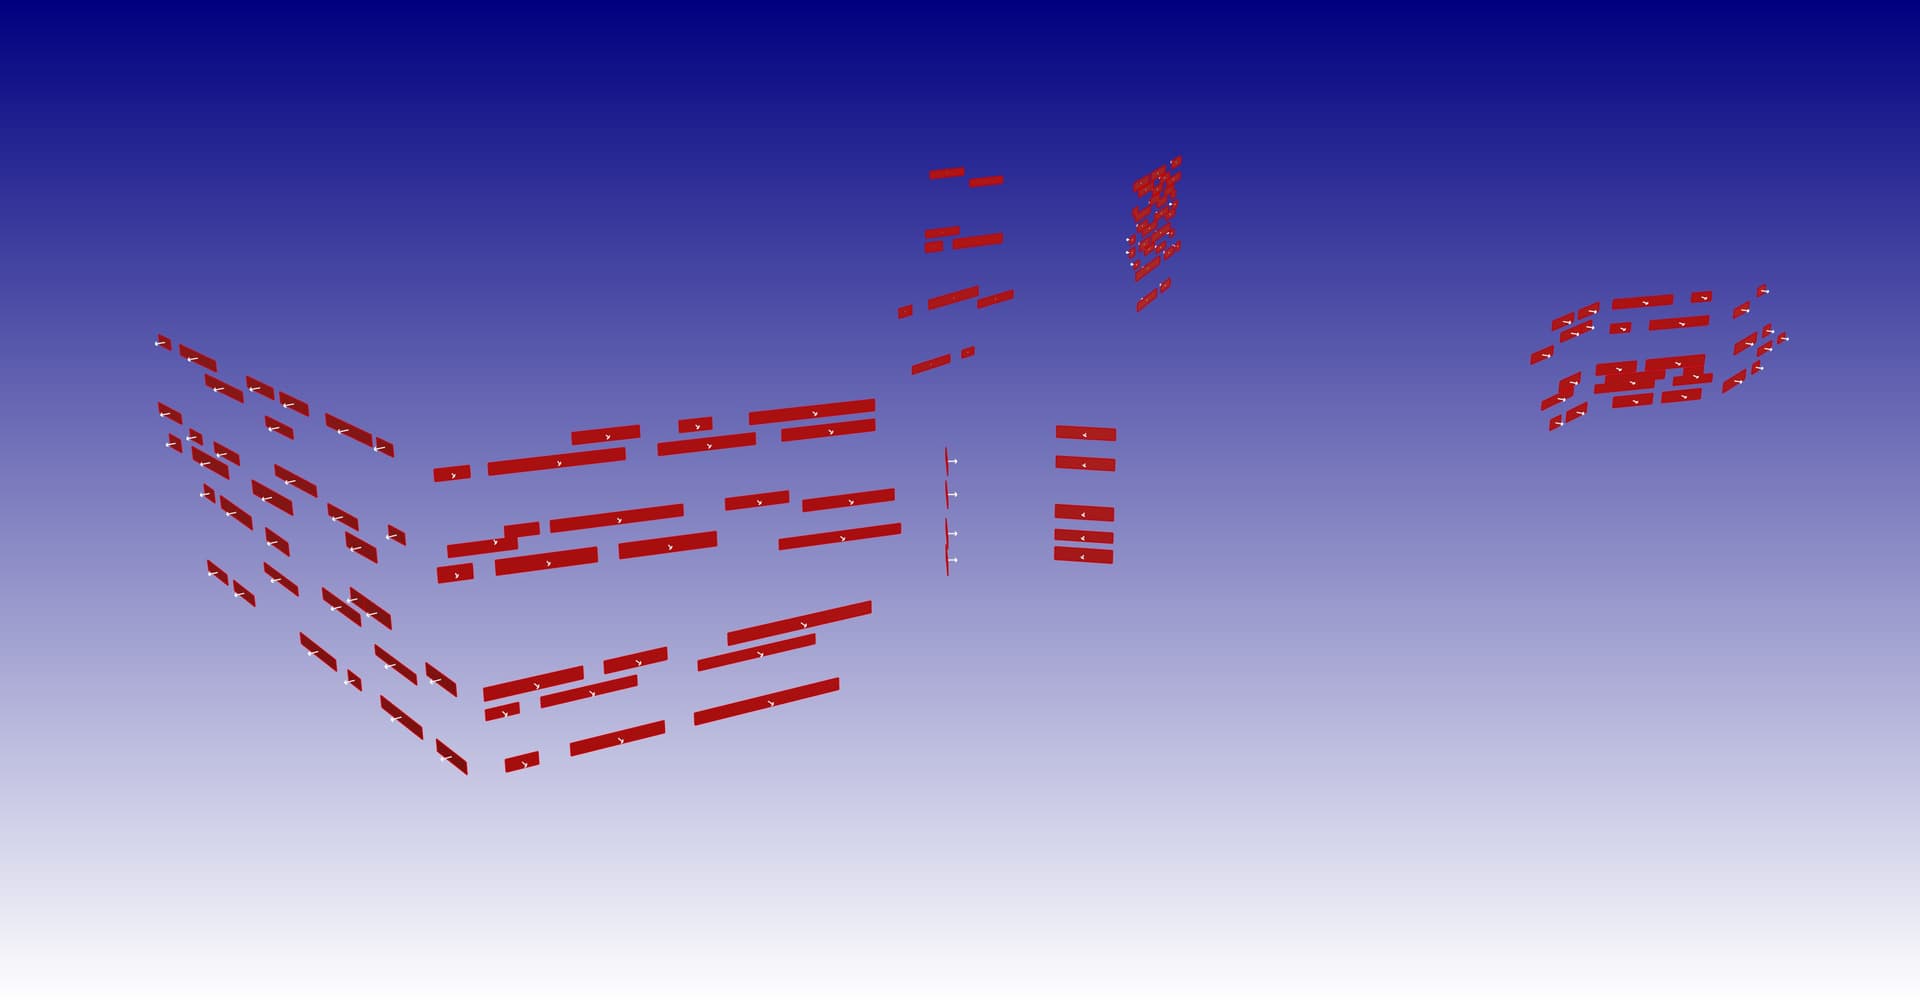
Many panels in various directions, different dimensions and shadow conditions… for use in a LEED submision
Question #1: is how best to achieve a good 8760 result?.
I’ve attached my latest grasshopper file of the 8760, with separate facade visualisations (this is not important) and a combined result (this is critical)
It also includes both the LB and HB simulations on the buildings along with reference sums to compare HB & LB and they don’t come close to the same results, even after I multiply the HB results by the areas…369755 kWh vs. 763409 kwh…
Question#2 is:what am I doing wrong to get these two results?
Question#3: Why do the HB visualization on the building look for messed up?
Question#4: Would it be possible to add an automatic 8760 output to a future HB or LB component that combines all solar surfaces in one output (this would be most useful for LEED and other submissions as well as client presentations)?
8760-radiation study per facade-internalized.gh (511.5 KB)
BTW I love your work, help and all that I can do with HB & LB, but I’m just not technical enough to figure this out
Thanks
Hey Anders,
Your script looks overly complex and it’s causing some problems. I’ll put together a fix for one facade for you now and send it over.
Cheers,
Charlie
Here you go
8760-radiation study per facade-internalized.gh (557.1 KB)

#1 See my approach in the script, might not be the best way, but I’m just multiplying the results by the face areas and doing a mass addition and checking the units.
#2 Honestly rather than looking at what you did wrong, hopefully my part of the script just shows how to do it correctly. I was confused how you were creating your analysis points. I would use the LB grid component instead to then generate a HB sensor grid.
#3 It looks messed up because your results don’t match your mesh, same explanation as #2
#4 Personally I think the way it works atm is sensible. If you wanted one single result you could create just one analysis grid, instead of one per facade, which would give you the combined result (HB Annual Irradiance, radiation output, multiplied by the face areas from LB Generate Point Grid)
Edit
I just added an edit that converts from mm2 to m2 to give the correct kWh for your file units.
8760-radiation study per facade-internalized.gh (552.5 KB)
This is amazing….I based mine on a mix of older scripts and I clearly didn’t know what I was doing.
I’m still trying to understand what is going on the different corners of your recipe, but THANK YOU!
I have one minor question…If I change the grid size to 100, 200 or 500 mm instead of the 1000 mm in your file and it won’t run the complete script…Any idea why?
anders
Hey Anders,
Glad to hear it was useful to you 
I just tried changing the grid size to 500mm in the part of the script I added and it worked fine, could you post a screenshot of what’s going wrong in yours?
Cheers,
Charlie
I think rhino/grasshopper/LBT just needed a reboot…now it works just fine
thanks
@charlie.brooker Is it correct that the 8760 shows average intensity for every hour in w/sqm?
…and that if so, then to get the 8760 to show total combined PV production for every hour of the year I’ll have to multiply this intensity with the area of each surface and them multiply this with the area efficiency before feeding it to the graph component…is this correct?
thanks
anders
Hey @Anderssmith,
I’ll try 100mm on my laptop and get back to you - tbh I’m not the best at debugging those errors so might need to lean on someone else in this thread for that.
Yes that’s correct for generating the PV production 8760 plot. I’ve done it slightly differently in this script attached, but the way you’ve suggested should also work perfectly well.
8760-radiation study per facade-internalized (1).gh (560.0 KB)
Double check my maths though!
Edit
I just tried to run with a 100mm grid size and I get the same error. Might be worth searching the forum for what’s causing it.
If we are looking at the same stuff, a grid size of 100 mm yields 63000 sensor points which can produce quite hefty result files. Check if you are running out of disk space as the recipe is running.
Hi @charlie.brooker ,
Sorry if this a stupid question.
When the results from HB Annual Irradiation (based on the grids) gets multiplied with the areas of surface, doesn’t that cause a problem when there may be many test point to a surface?
Wouldn’t it be correct to multiply the output with the areas of each grid cell, or multiply the average for each surface with the area?
My end-goal is to visualize the total production for all solar facade surfaces over the 8760 hours of the year (…and that when adding all these up I get the total yearly production as I would from LB as a check.)
Thanks
Hey @Anderssmith,
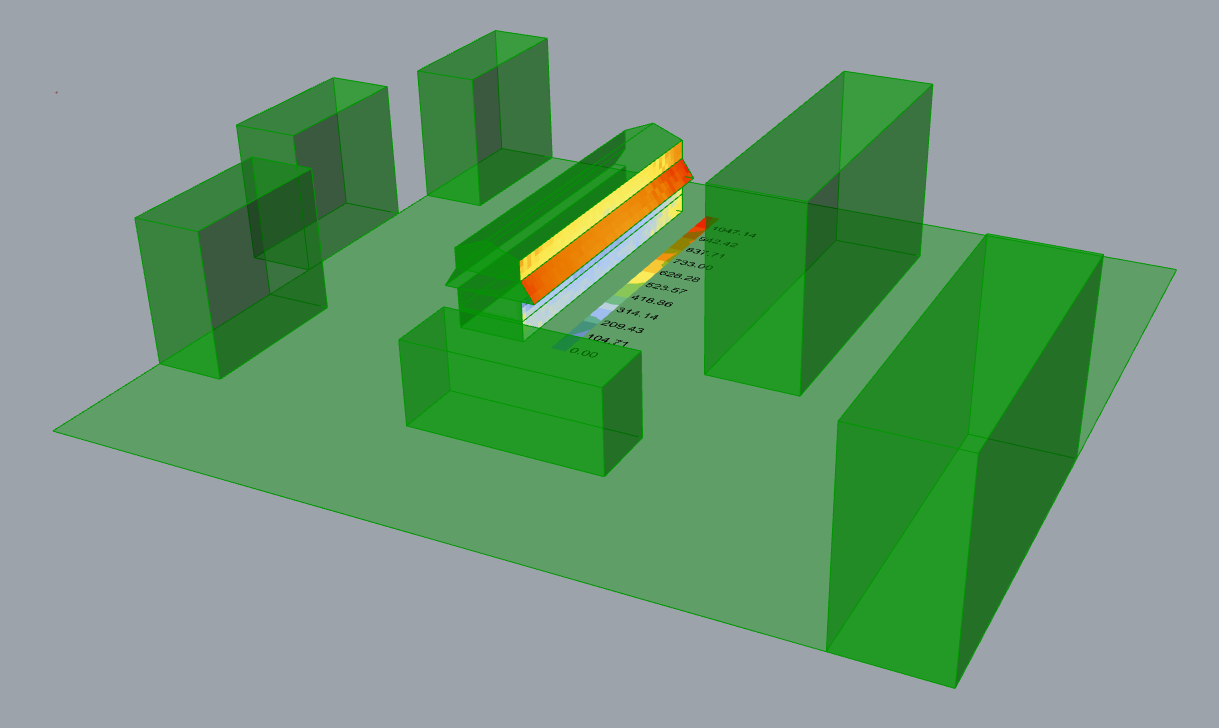
Not a stupid question. The output of LB Generate Point Grid component gives the “sensors” (analysis points) for the simulation. Each of these sensors has an associated mesh face, and that has an area (from LB GenPts). As your geometry is all rectangular all the faces have the same area, but for more complicated geometry you’ll often have faces with varying areas.
Visualised here:
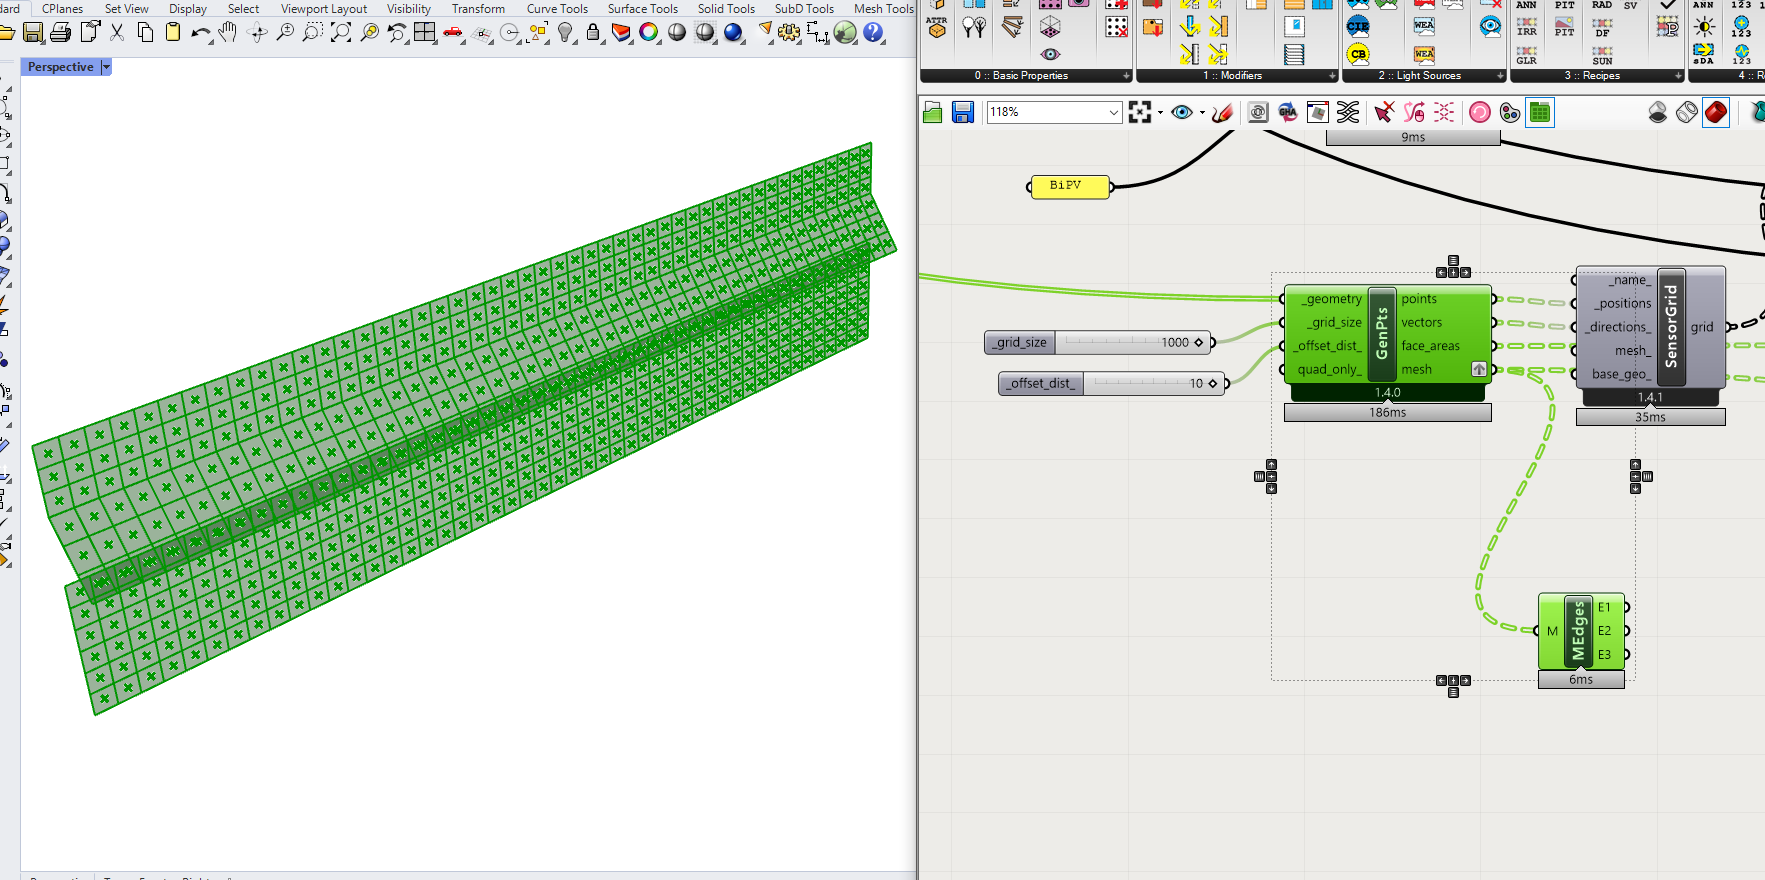
I’m using the W/m2 result values for each sensor and multiplying them by their associated face area of to give the W values. Multiplying each sensor result by its associated face area avoids any error if not all face areas were the same.
As it’s hourly data the result is a Wh value. We can then add up all the Wh values for each sensor to give the total hourly incident radiation for the whole sensor grid.

Hope that makes sense!
Charlie
Thanks, it does.
I thought the face_areas mentioned on the grid component where the same as the areas of the geometries going into the component and not the analysis mesh facades.
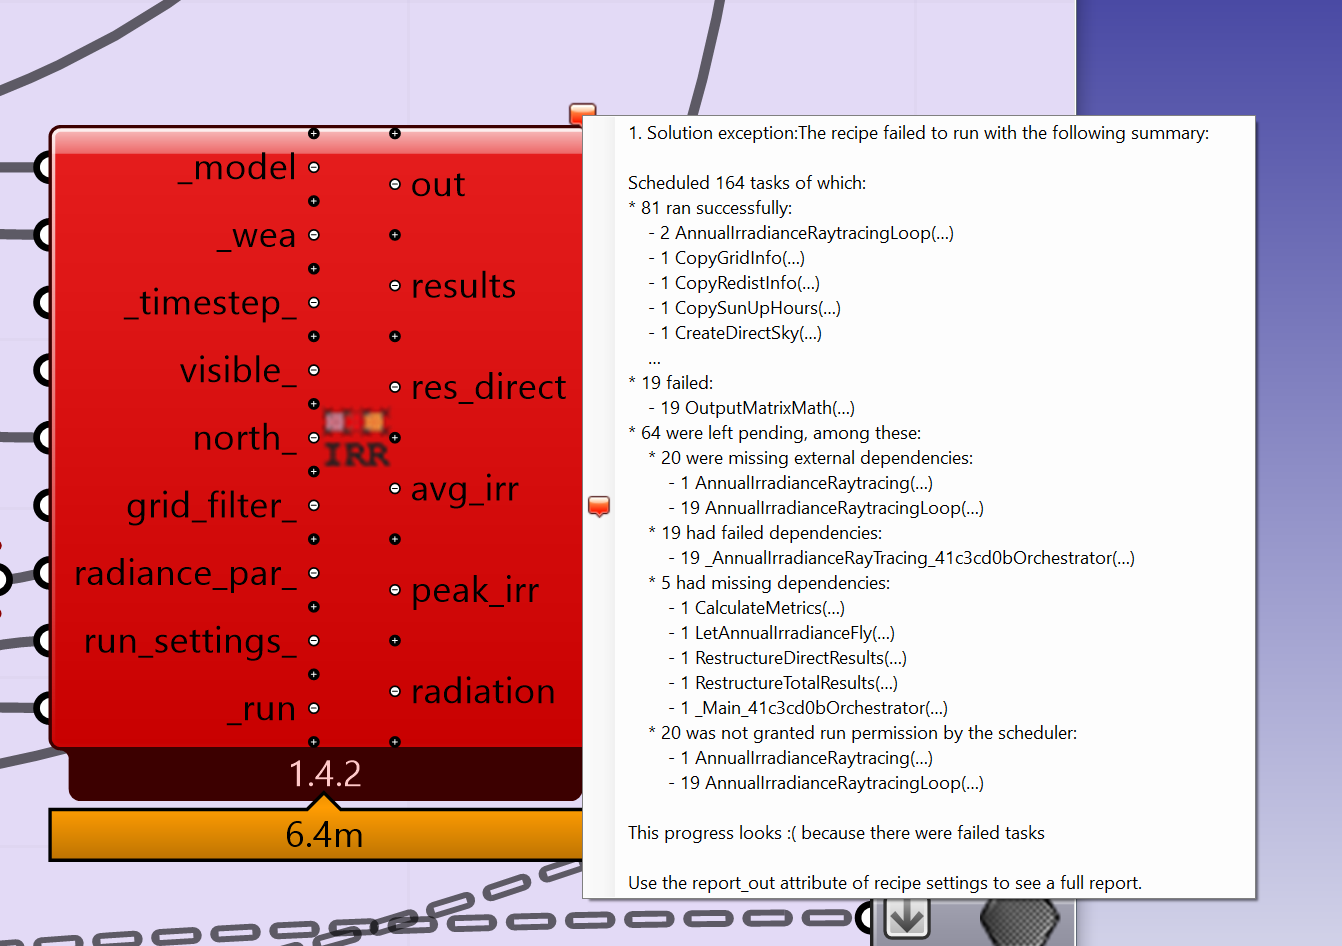
I tried running all facades at the same time and it threw up a couple of errors that looks like overflow, so I think array limit in grasshopper is what causes it to fail when I set a low distance for analysis grid
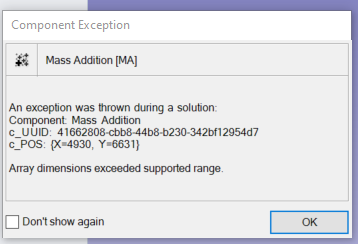
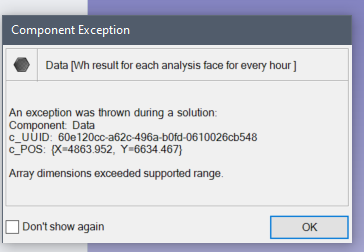
(the data set reached 5,8gb with a resolution of 400mm)
…the errors in the mass addition and data components is due to 147439560 values in the array… 
Not surprising when you’re dealing with that much data! Just need to consider what level of detail you really need and for what, and set up your model accordingly. Or if you need that level of detail you could consider moving into python and using the LBT python methods to read results and process them
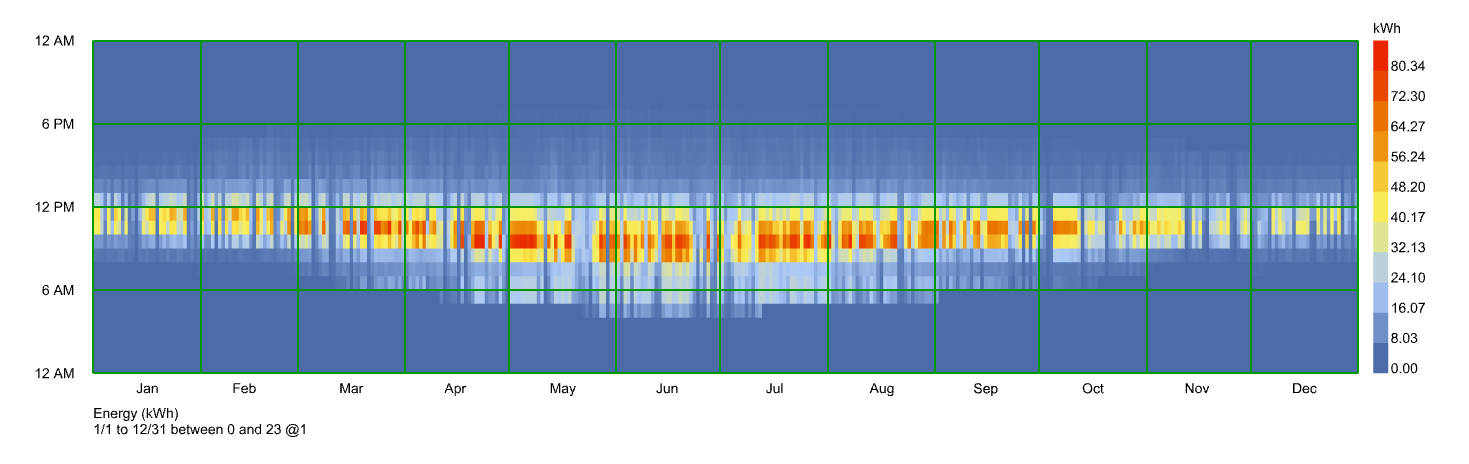
It works beautifully, so I just wanted to thank you again and ask if you had a quick solution to reformatting the 8760 hourly data into a monthly bar graph of total monthly productions?
When i plug the data stream into the LB monthly display component, I get a nice little bell-curve graph for each month, so I need to add up each month before feeding it to the display component…is there an easy way to achieve this?
thanks
anders