Hello everyone!
I’m runing a quite simple simulation.
I have a fixed square PV with a slope of 30°.
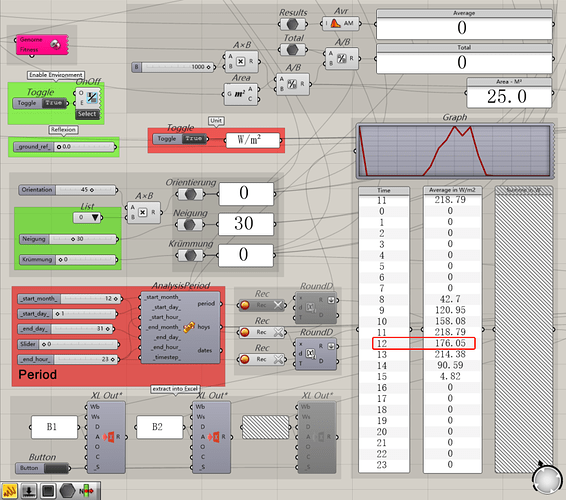
I run IncidentRadiation of the ladybug to simulate the radiation for each hour throughout the whole day, averagely in each month.
I use the “animate” function to let the hour slide automatically run from 0 to 23 and record the average result of radiation simulation meanwhile. (how lazy I am)
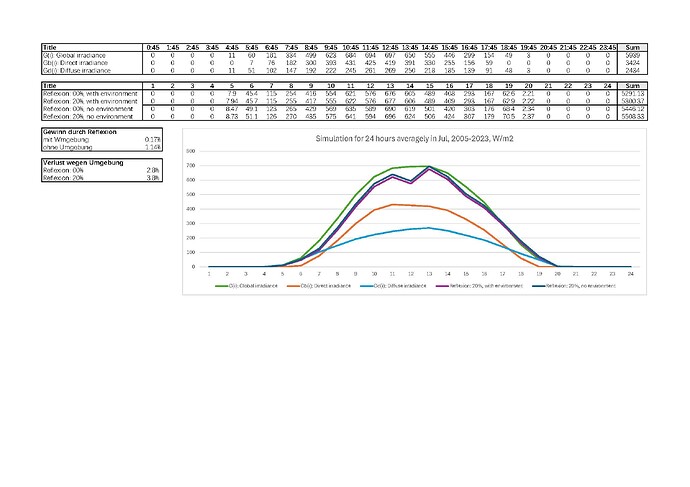
In the end I extract the numbers into Excel and outlined a diagramm of radiation simulation for 24 hours in a month.
Origianlly I want to compare the result with/without reflexion and with/without environment.
I use the data from the Photovoltaic Geographical Information System (PVGIS) of European Commission.
In order for me to know how it works, I also put the Total radiation, Direct irradiance and Diffuse irradiance from the PVGIS website into the diagram.
When I look at the result, most are totally fine, the radiation simulation aligns with the tendence of the total radiation.
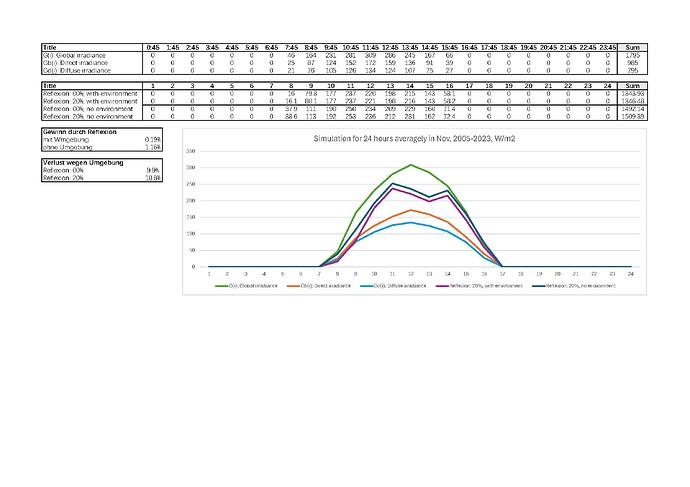
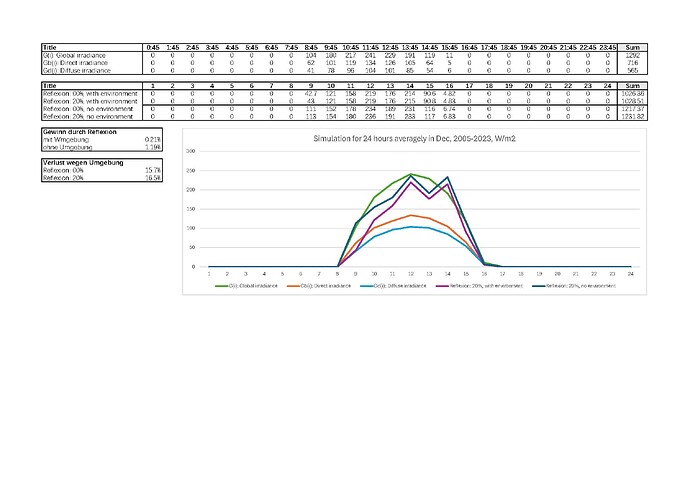
But in July, Nov and Dec, there is a sudden fall at noon, while the total radiation is still almost at the peak.
Well, in july, I can guess that’s maybe because Direct irradiance has its peak at 11 and Diffuse irradiance has its peak at 13, so the simulation falls a little bit in between at 12, but it should not fall that much.
But in Nov and Dec, I really can’t find a reason to explain.
(The image is the simulation for Dec, you can see the sudden drop at midday marked in red box)
I also upload the Excel diagram of July, Nov and Dec.
Does anybody have a clue? A simple guess may also help.
I will be very grateful for any reply!
Greeting from Germany.
Gruß aus Deutschland.


