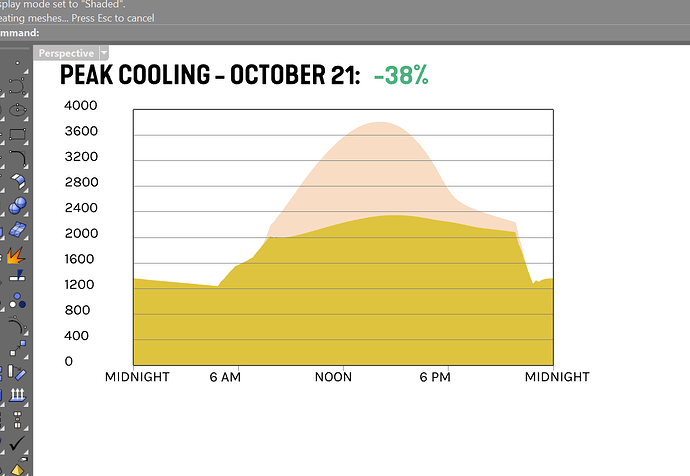
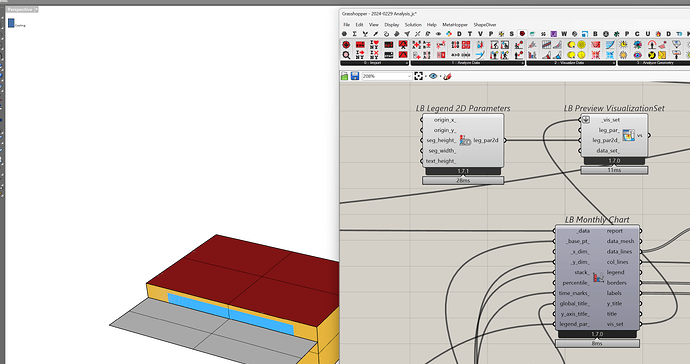
With the new visualization set concept in the latest LBT versions, I’m curious if there is a way to render a LB Hourly/Monthly Charts to the screen easily? all I seem to be able to do is render the legend of the chart, not the actual chat. I think this would be awesome to be able screen render the charts, and perhaps other things like shading masks, 2d suncharts, etc.
I’m currently using human components and although it works, its pretty tedious to get each piece of the chart to show up.
Appreciate any insight!
example:

