I need to do an annual DGP calculation.
Knowing the problem doing it through the Annual Daysim simulation,
I want to ask if is possible to simulate it through the Point In Time analysis, save the DGP value of every single hour, out from the Glare Analyse component, so to visualize it with the 3D-Chart.
I ask why I tried using the “series” component to analyze several hours in sequence, but at the end, shows the value of the last simulated time for the all hours.
Would there be possibly with another method, not of my knowledge?
I would to specify that I don’t need the HDR images of every single hours or to add a dynamic shading.
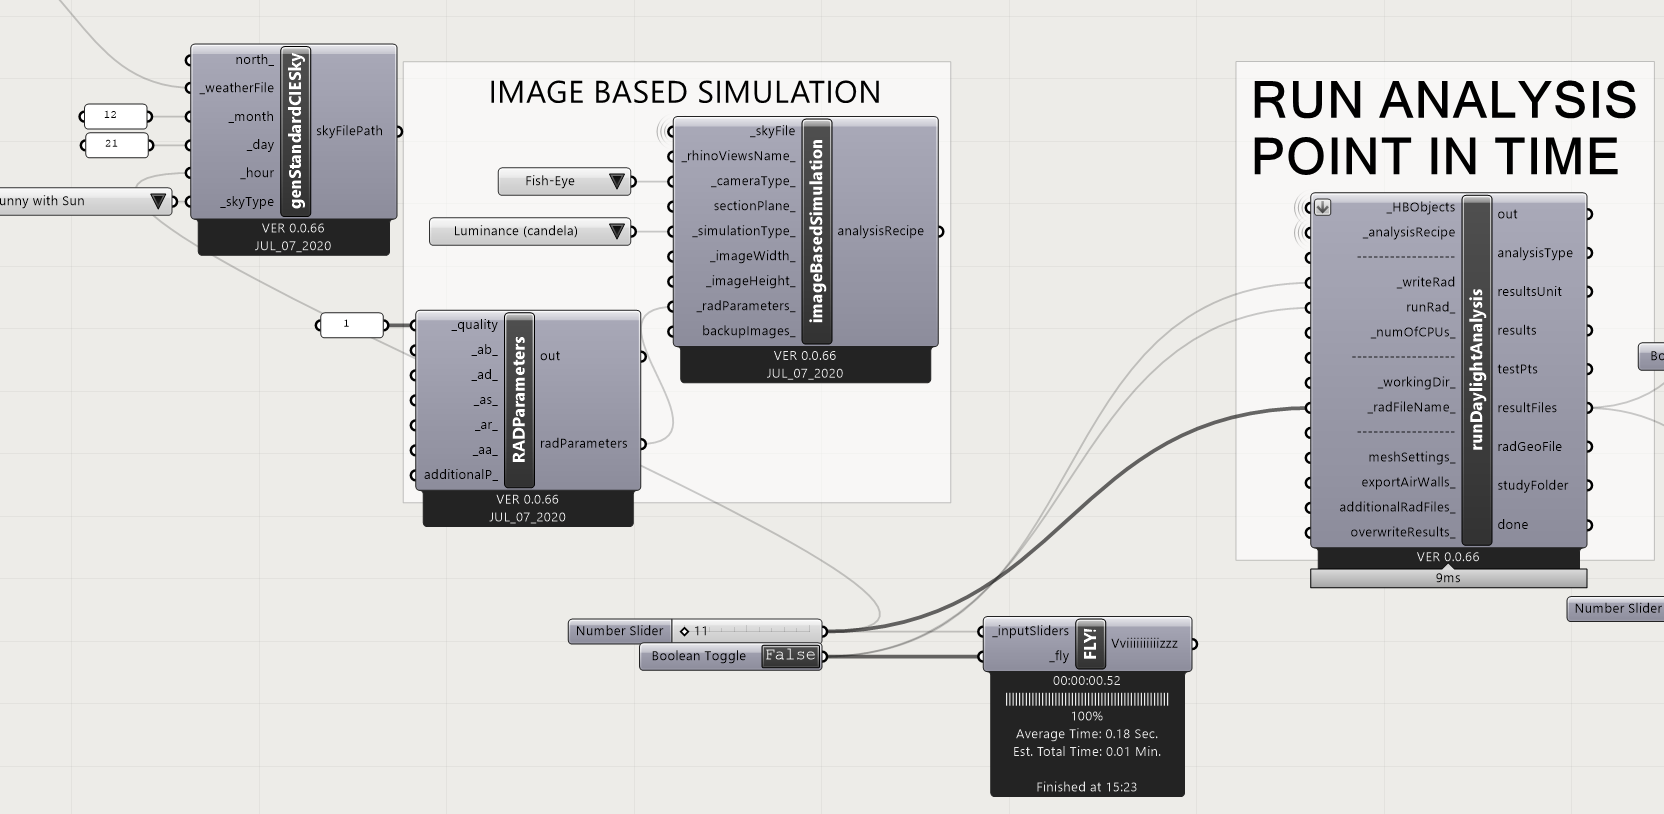
Using series components is perfectly fine but you probably have it set up in a way where each hour of the PIT calculation is overwriting the previous one. If you are looking to not eat up your hard drive with 8760 PIT simulations (giving each one a unique name), I would recommend animating a slider through the hours of the year and using the native Grasshopper “record” component to record the DGP as the animation happens. Or you could use Colibri in TTToolbix to animate and record the values as you see in this example.
I don’t know why the FalseColor command is not including the max color of the legend. That might be a question for @mostapha or one of the other Radiance experts on the forum.
I am having difficulty understanding this procedure.
unfortunately I don’t understand how to use your example for my cause.
How do build the whole calendar in Colibri? Do I have to create a slider for every single day?
Because if I create a single slider for the month/day/hours, I would have 12 months of 31 days and I don’t understand how to connect the period to be analyzed to the “sky” component.
I would be really helpful to understand the right workflow to generate and saved all the DGP values in a list, even without to generate the image.
… the slider output to?
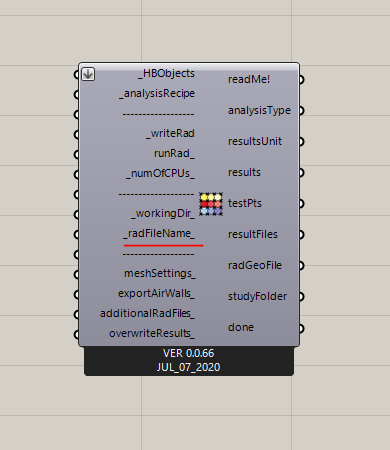
The Glare Images are generated from the _GlareAnalysis component, I don’t understand which input allows me to change the name of the single renderings.
as you suggested, I connected the slider to _radFileName to create a new folder for each simulation, but the analysis does not start due this error: iteration over non sequence of type float.
Any advice for this problem?