Hi guys
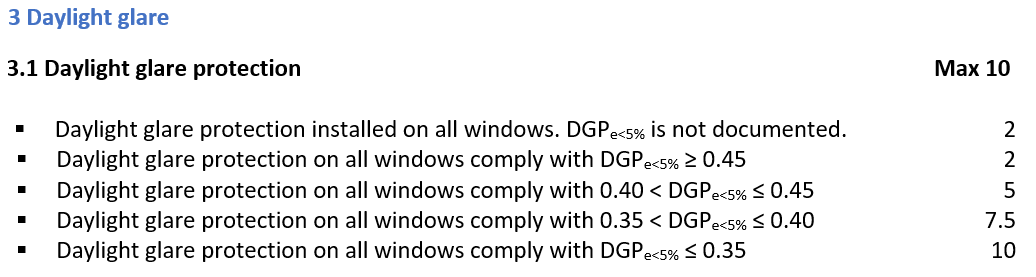
I would like to use LBT to document glare according to the danish certification scheme dk-DGNB version 2020, which uses the method described in EN17037. The criteria in DGNB are as follows:
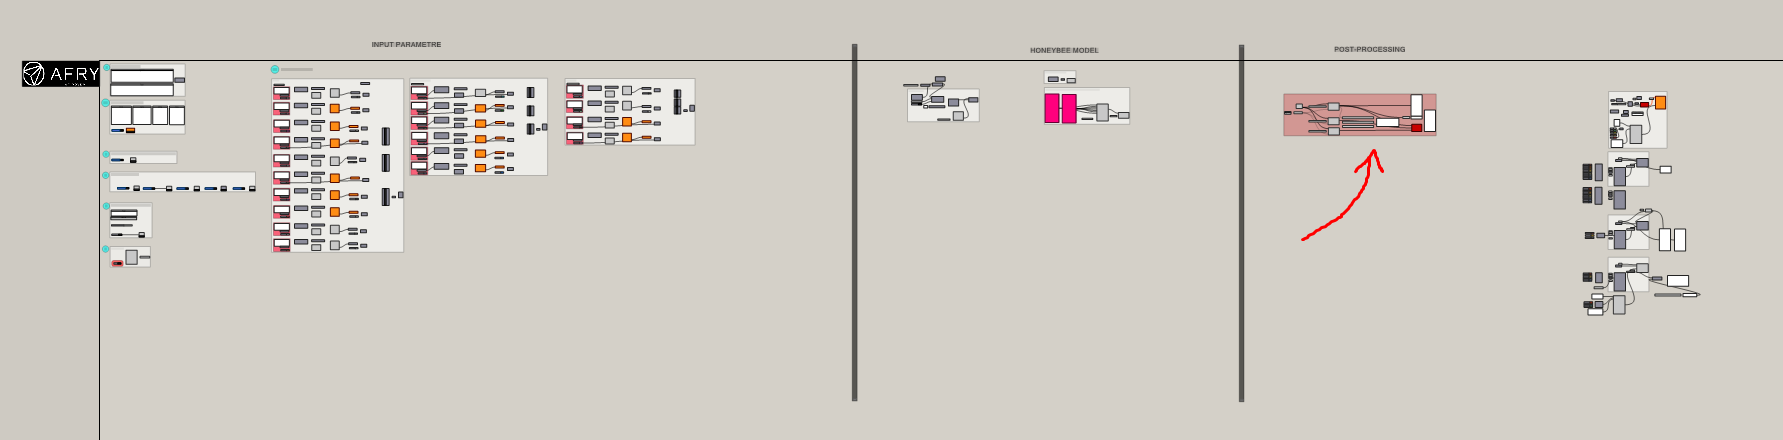
Now the question is: How can the HB Imageless Annual Glare component be used to document compliance with these criteria?
If I understand right, glare autonomy describes the fraction of the occupied hours where a given glare threshold isn’t exceed. So for a threshold of DGP > 0.45, a GA of 100% means that the probability of experiencing daylight glare at a given view never exceeds 45%, right?
As we in DGNB have to look at DGP_e<5%, I assume that the sGA for each zone should be >= 95% to meet the criteria.
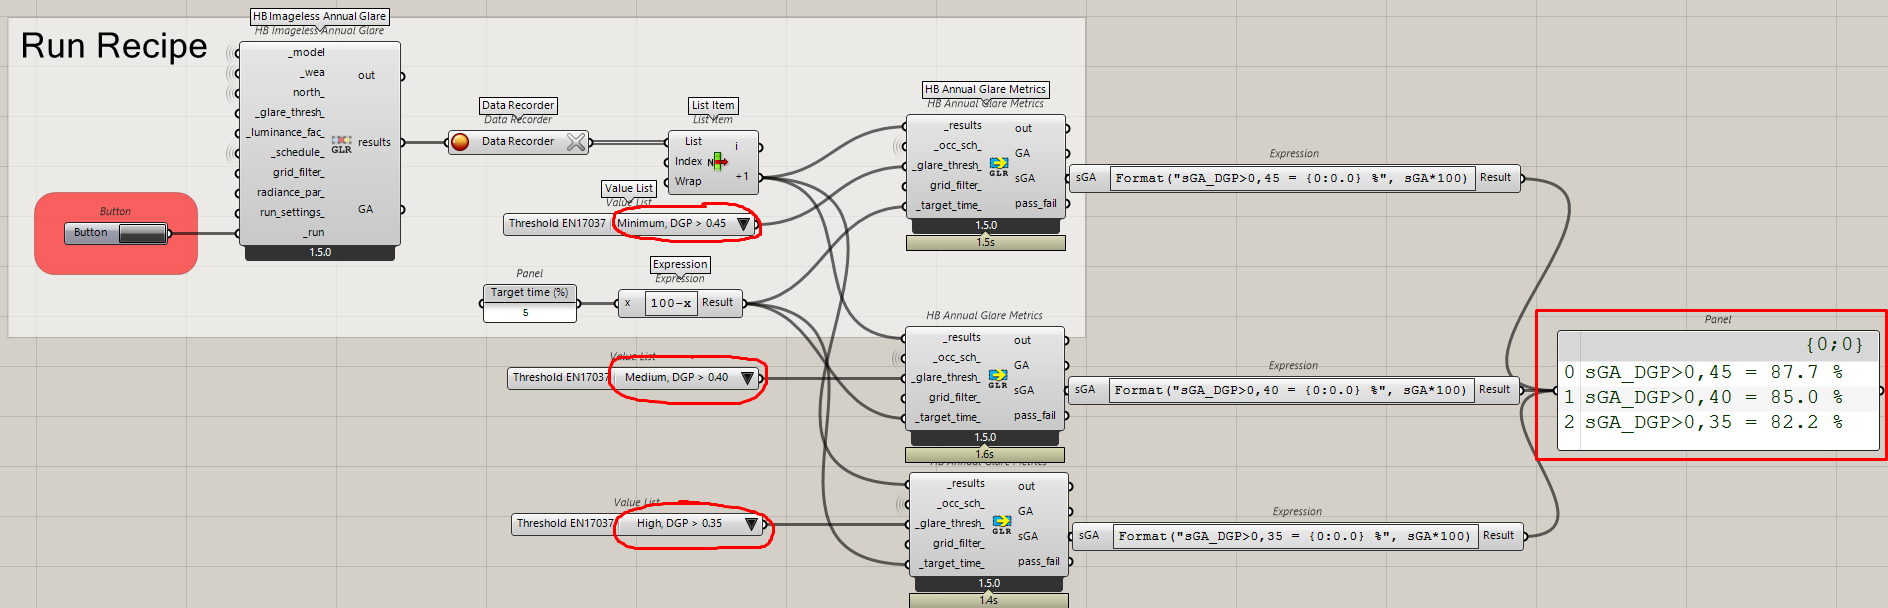
A way a of illustrating the sGA of each zone could be to have multiple HB Annual Glare Metric components with different glare thresholds like this:
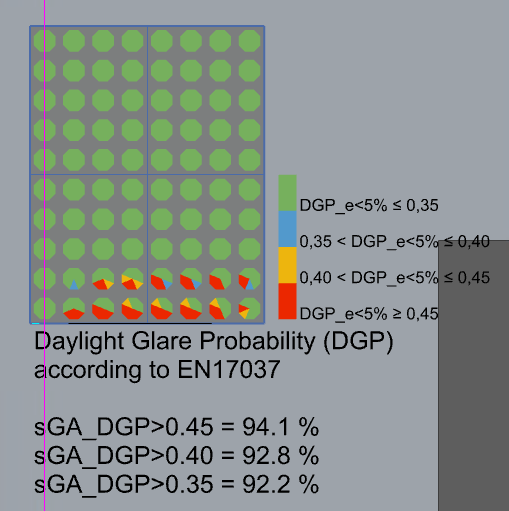
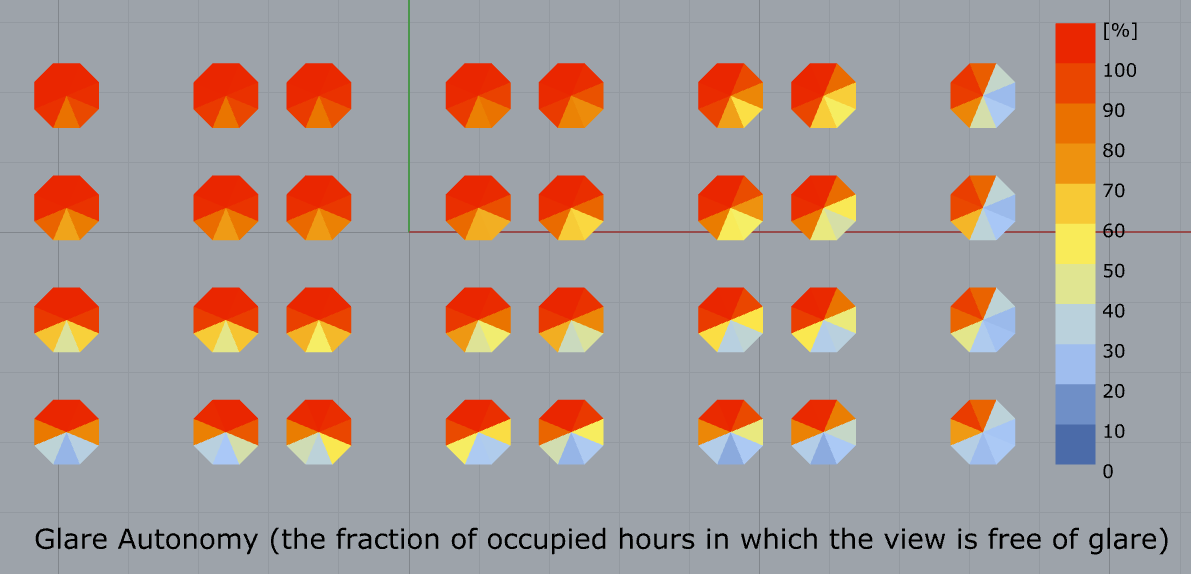
But is it possible make a spatial visualization of the results that contains all the threshold in one?
My thought is to have adjust the visualization so that it only has 4 colours, which represents the 4 DGNB criterias
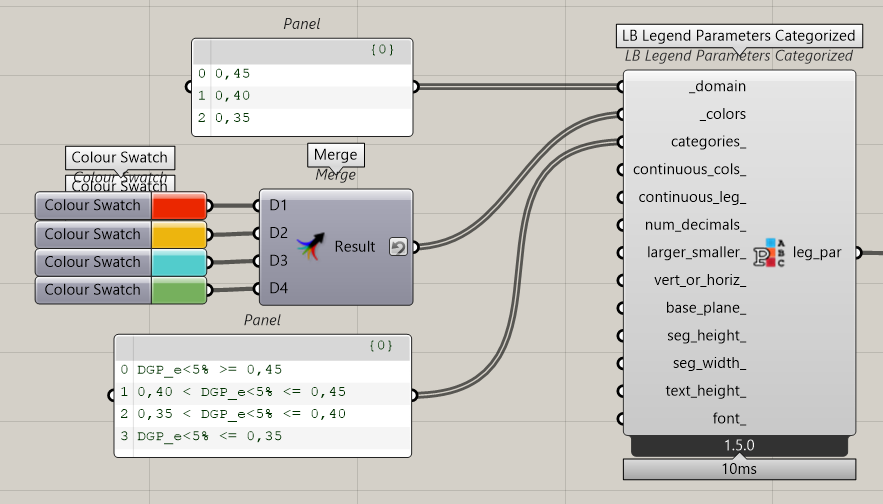
rather than showing the GA.
So I have the idea, but I can’t seem to figure out how to do it. Any good suggestions?