I´m Designbuilder software user although more I use ladybugtools, more I want to user ladybugtools.
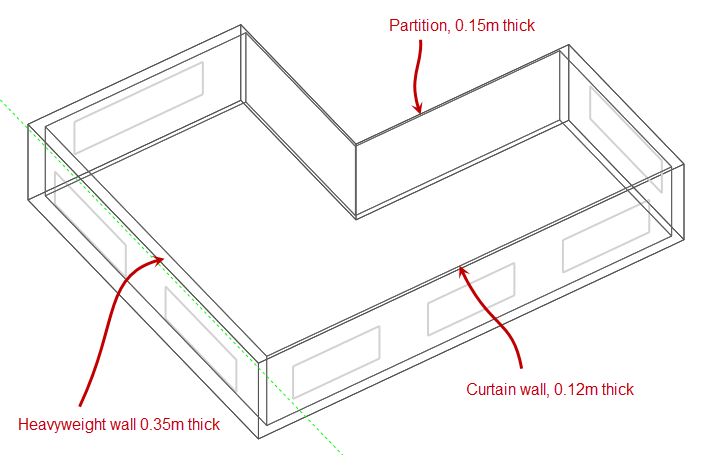
In DesignBuilder, a very nice feature is to model the geometry and let the software take into accounts wall thickness to get the right area. Could be a wish or maybe a useless feature here?
Also with DB its possible to get the a pdf report generated by e+. The same… useful or useless feature for lbhb?
example: 01_ePlus summary fragment.pdf (327.7 KB)
Hi,@JuanPabloTrujilloLev
I can not down the [01_ePlus summary fragment.pdf].
Based on my experience, this feature is not necessary for energy modeling. In energyplus, the right area is the area of the floor.
Hello @minggangyin , this is the fragment of the report generated by e+, available through designbuilder. Has nice features like unmet hours… etc ePlusReportPartial.pdf (476.2 KB)
For areas and wall thickness, DB generates the wall tickness and calculate the new floor are. You only draw the zone perimter and DB do the rest. I know that with this cocktail of solutions (LBHB) maybe this could be useless but its nice feature.
FYI, ease of access to the thickness of the walls based on the EnergyPlus construction is something that we have in mind for the next revision of Honeybee. You can see in the API documentation of the new code we are in the process of writing that Constructions will have a thickness property, which can be used to create offset surface visualizations like the one you cite here. For now, you can use some of the existing components like decompose material to extract the “thickness” property of each EnergyPlus material layer, which I realize is a pain but is the best I can offer for now.
As for PDF reports, I think you will generally find throughout the plugin that we prefer to give people the tools to make their own reports rather than having the software spit out some type of standard report. This is mainly because a standard report is that only takes a single click to produce makes it more likely for the reader of the report to not understand what the data in the report means or where it came from. When you make it yourself, you know what it means and you know how to interpret the results to inform design.