Hello all-
I haven’t been able to figure out a clean way to solve this & couldn’t find any topics about load profile curves, so I was wondering if anyone else might have insight:
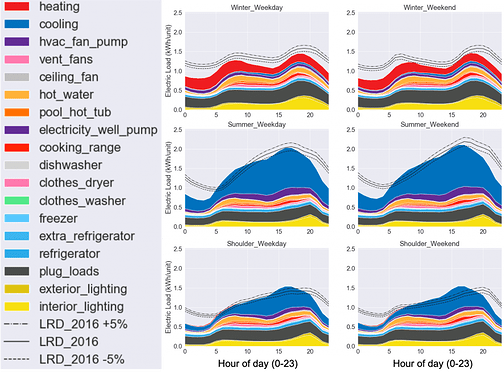
I would like to produce an end use profile curve, something like these:
Ideally I would like it to be the average daily load curves broken down by load type (cooling, heating, lighting, etc). But I would also be happy with an hourly load curve for design days or for totals (with no breakdown of load type).
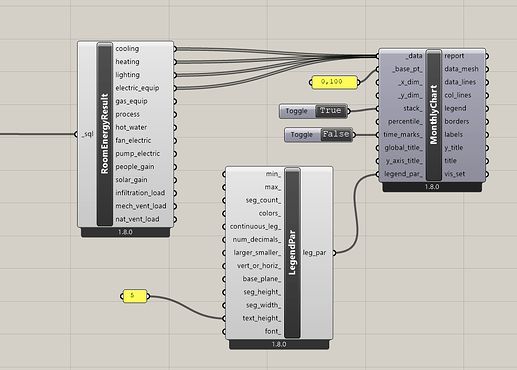
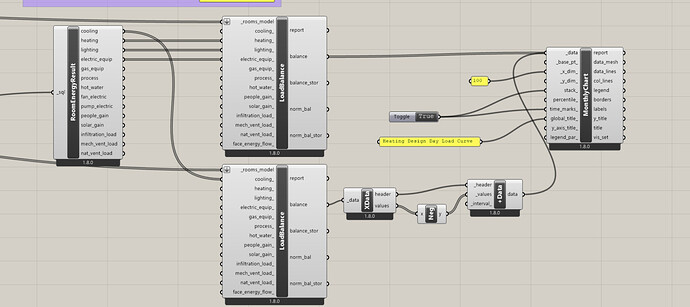
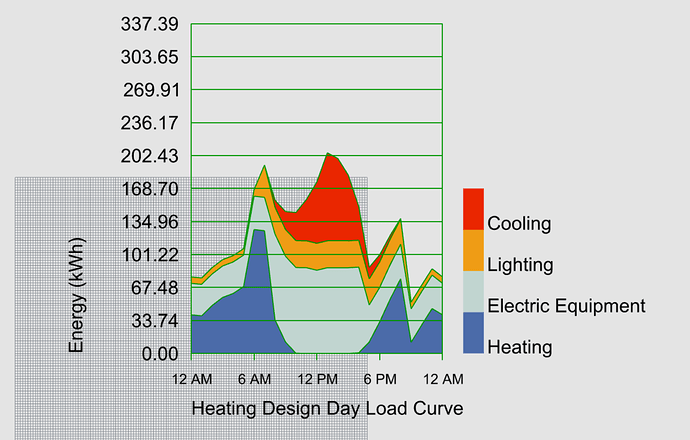
This is the closest I have gotten and I wanted to ensure I am understanding the results correctly:
Using the Room Energy Result component with the MonthlyChart, am I correct that this is giving me average daily load curves for each month?
If so, is there another component that I am forgetting about that can give these results not broken down by room?
If not, are there any recommendations for a better way to get toward creating that profile curve?
Thank you
LoadCurve.gh (210.7 KB)


