I’ve been working on an article where I’m analysing a building in different contexts.
at this moment me and my research group are analysing the illuminance data, and for the spaces we are simulating, we need a range of 100 - 1000 lux instead of the default values.
anyone knows where in the code of the components I can change these values? or, if I’m more lucky, anyone knows a component to change these default values?
I looked into the source-code for the HB component that retrieves the UDI values. It appears to me that the thresholds for UDI are hard-coded in Daysim as even the Daysim header file does not seem to have an option to change them.
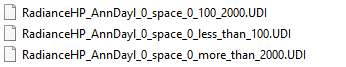
One option would be to hack your way around it by just calculating UDI with a custom gh component and then replacing the files that exist in your Daysim run. Daysim writes three UDI files for each run.
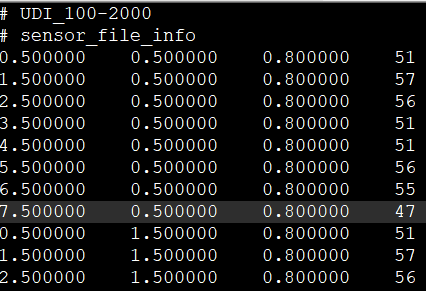
They look something like this:
Based on the HB source-code, as long as the filenames remain the same, you can visualize any results of your choice.
Regards,
Sarith
(PS: In case I am missing something, please feel free to chime in @mostapha)
Before posting here, I was thinking of making some changes to the values in a copy of the annual analysis component to define my custom range. But first, I needed some confirmation on that hypothesis.
and now I see that my thought was wrong and I will have to go through daysim.
I am not a great programmer and only have a modest understanding in python, but I will research how make this suggestion that you’re presenting.
I only have one question: in this example above, what values do I have to change to choose my range?
Hi Vinicius, the basic concept in UDI calc is to check the illuminance level at every point for every hour and then bin them into three separate categories based on thresholds (default thresholds being <100, 100 to 2000, >2000). Based on your original post, the thresholds for your calculation will be (<100, 100 to 1000, >1000).
The values that you see in each line of the screenshot with the black background are the (x,y,z) coordinates of a sensor followed by the number of hours for which that sensor receives between 100 to 2000 lux.
It shouldn’t be that hard to create a custom component in grasshopper to do this. I am pressed for time this week, but I might able to put something together this weekend or early next week.
I’m learning yet how to use honeybee and didn’t explore all of it.
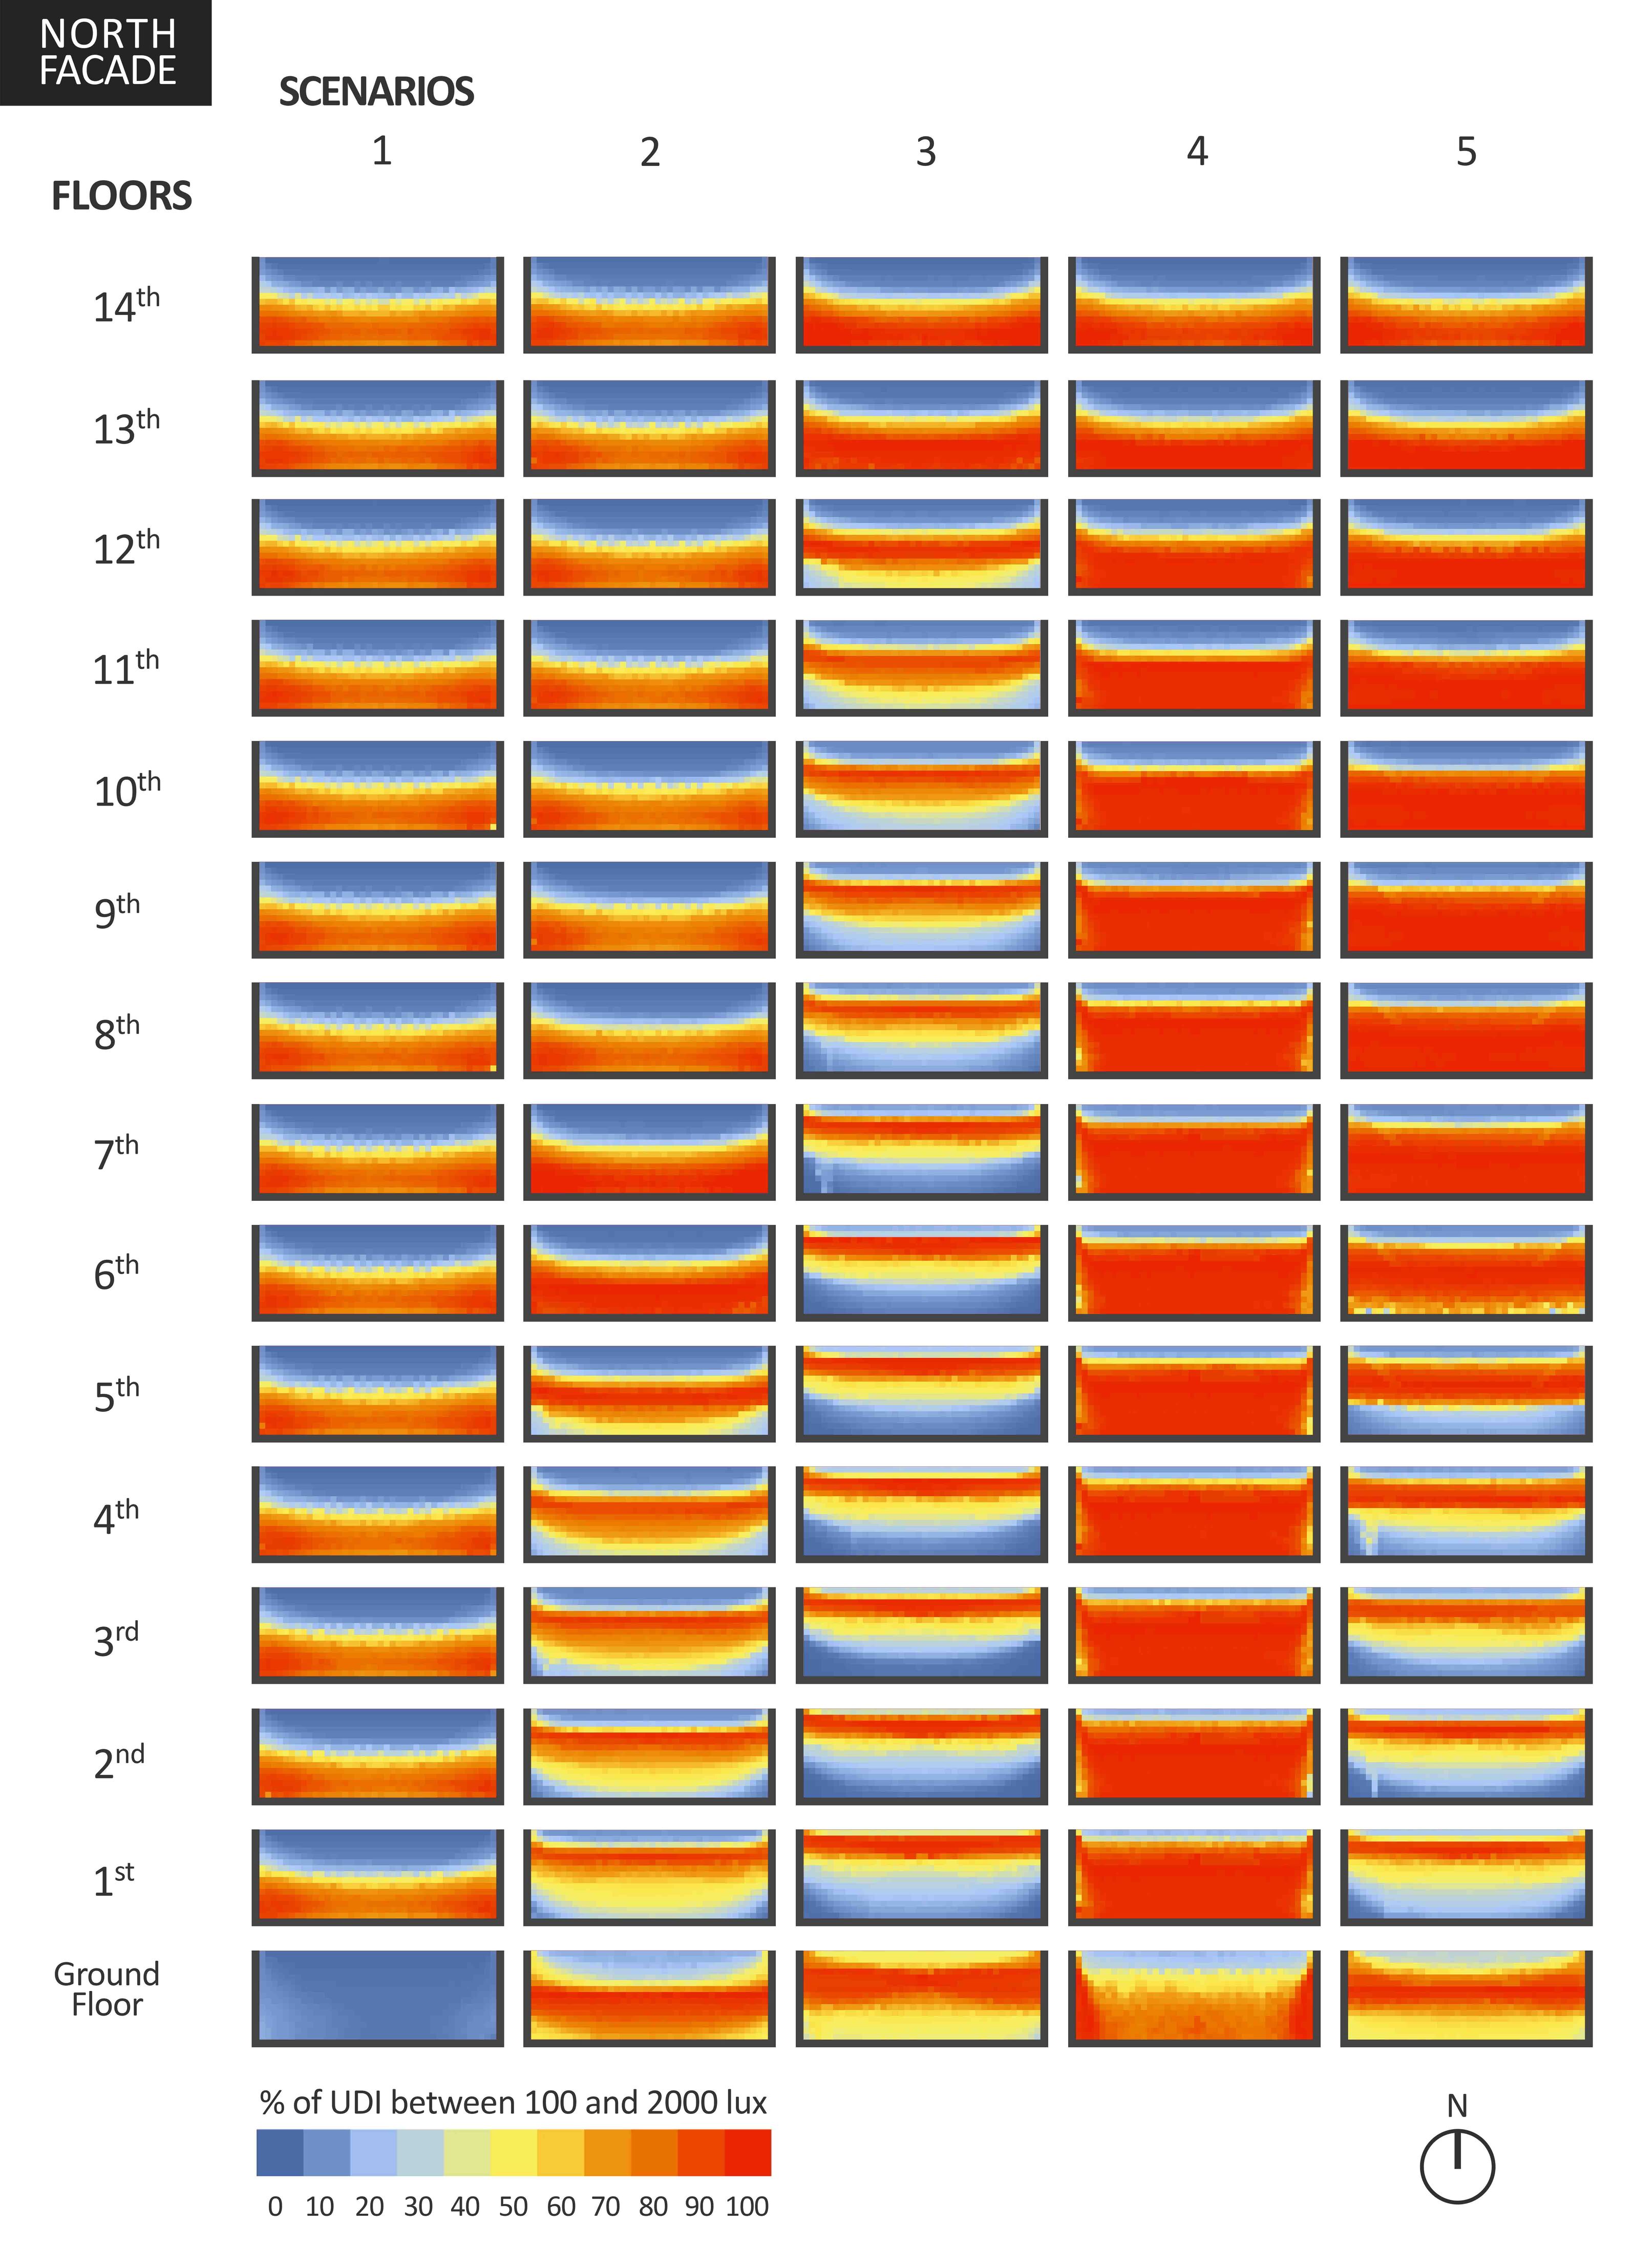
these last weeks I was stuck in the analysis below and ended up thinking in the more difficult alternative!
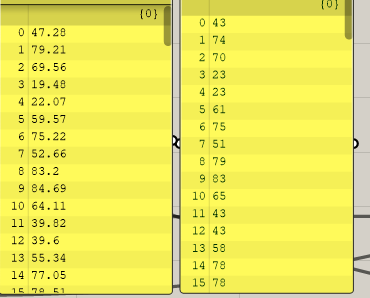
Thanks for the reply. I tried different components i and ii in the same 100-2000lx range, but the results (I didn’t change anything except the component that calculates the UDI) are different. I am confused as to what is going on here.