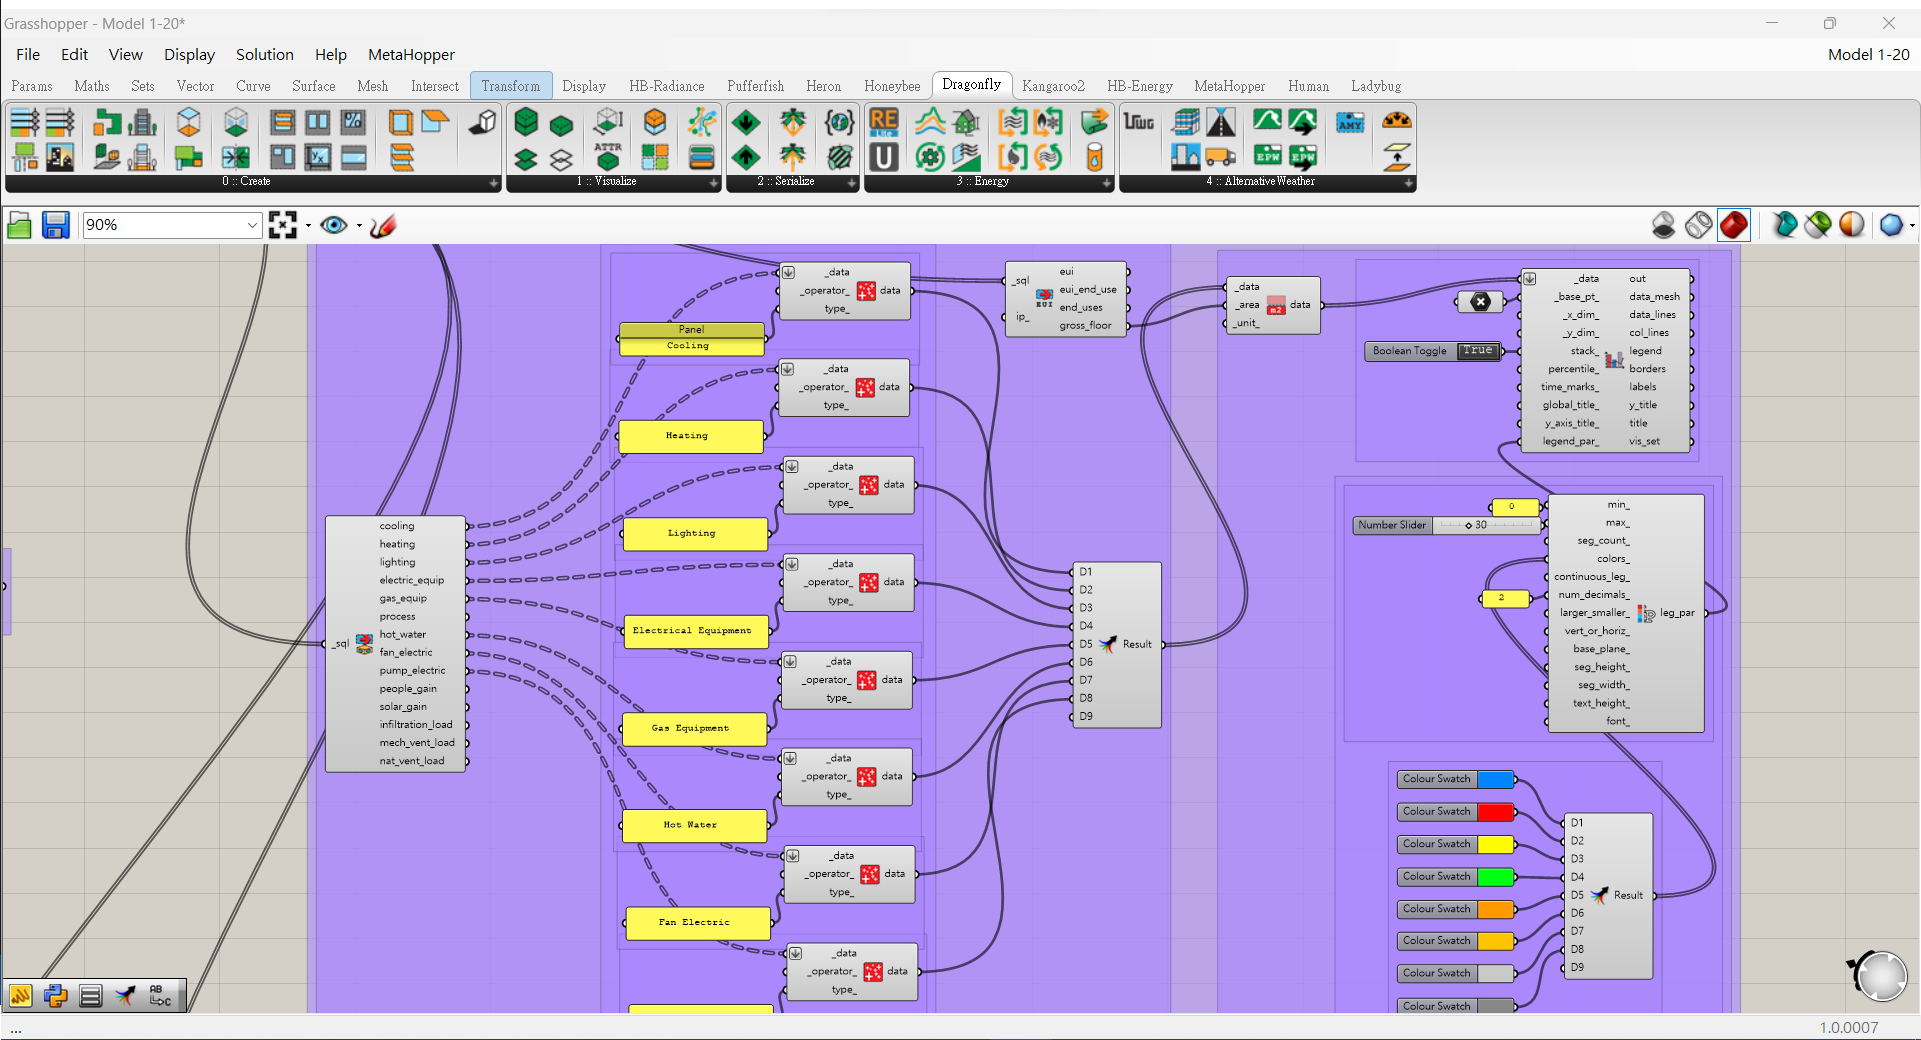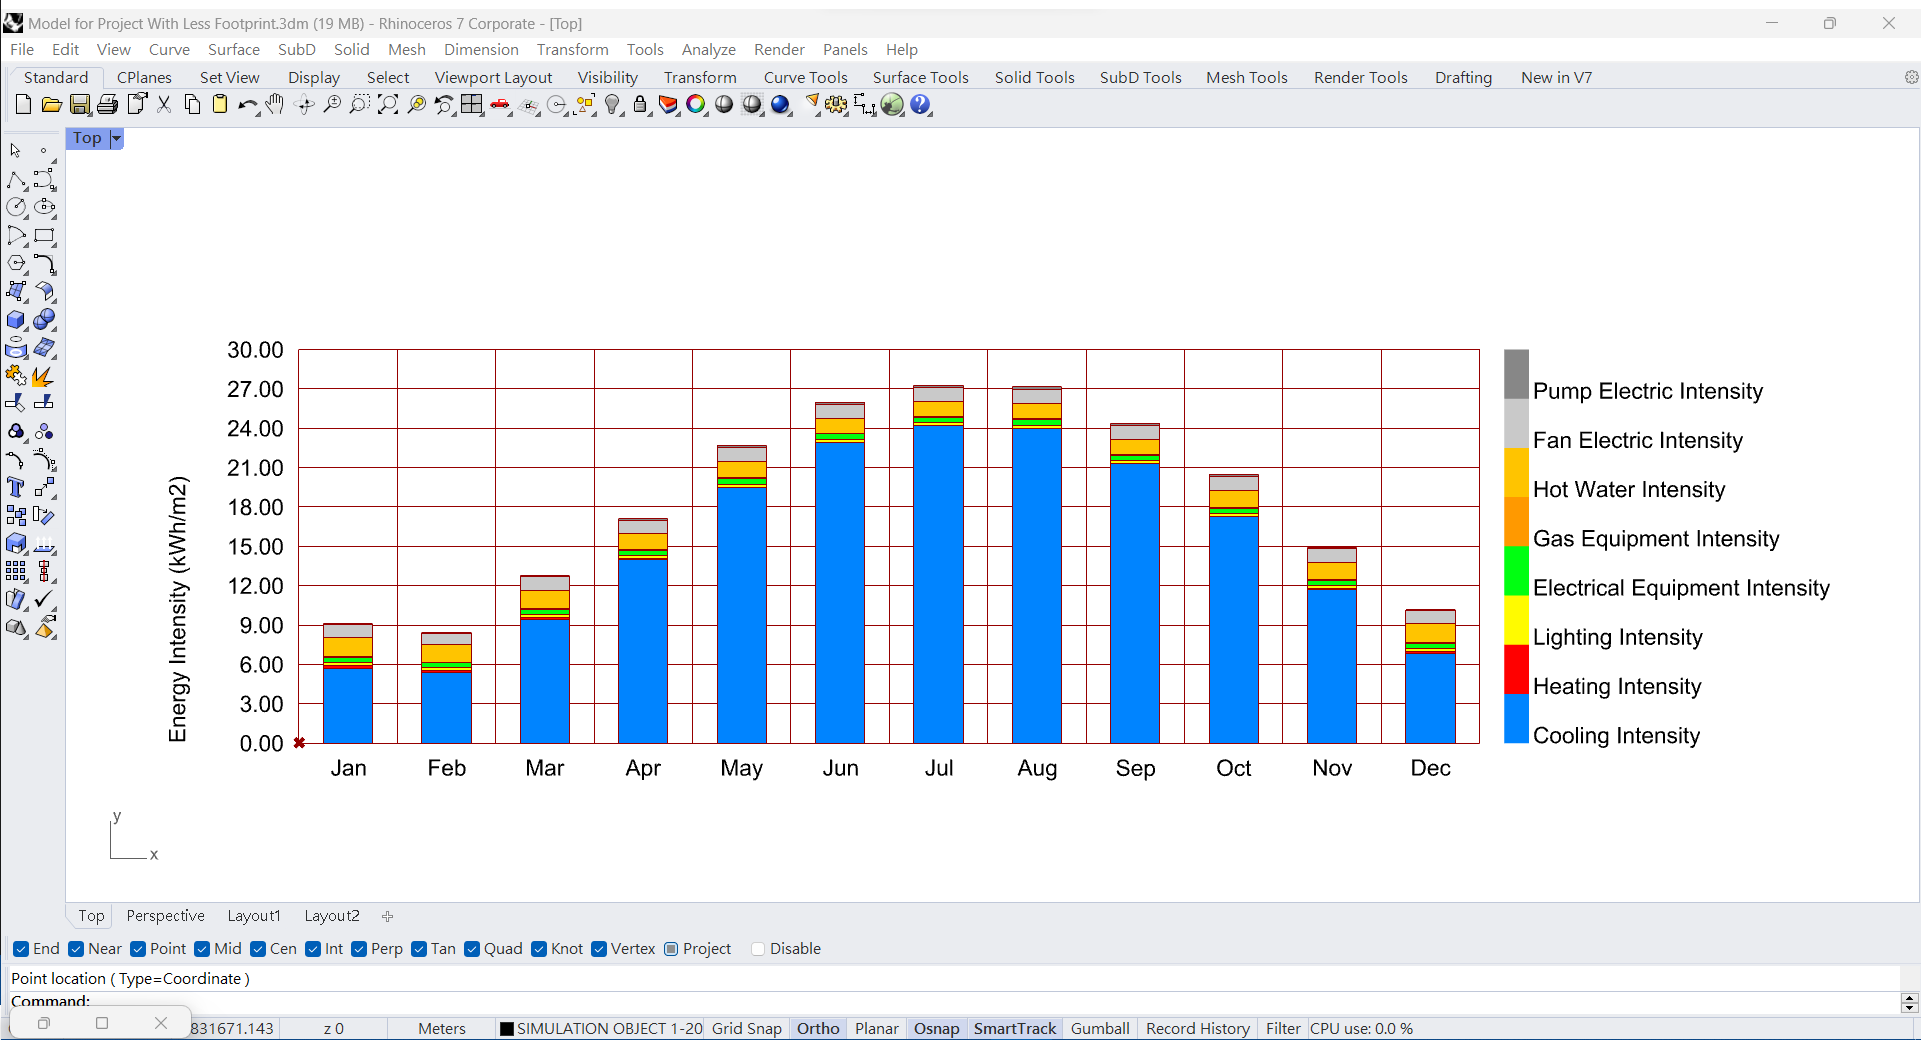
When i follow the tutorial Dragonfly : Visualizing URBANopt Simulation Results - YouTube , i plot the following graph, which is kWh/m2.
However, I want to plot a chart with the unit W/m2 or MW. Therefore, if I want to plot the chart with the mentioned unit, what should I do in the grasshopper, thanks.