Color Room Peak Load

Hello everyone,

Is it possible to use the Color Room component to visualize the Peak load of each zone?

Regards.

@Barbarur
Peak load of the sizing simulation or the energy use simulation? The first one is quite difficult perhaps impossible because the list of values does not always match the list of rooms. For the second one you have to find out at which timestep the peak load appears.

Hi @Erikbeeren ,

Yes, the idea was to use the Peak load values from “HB Read HVAC Sizing (ReadHVAC)” or from the “HB Peak Loads (Peakloads)” components.

I didn’t understand why the zones don’t match with the rooms, specially when all the zone names are “Room_…”, obviously I’m missing something.

Another option, I think it would be to use the component “HB Read Zone Sizing (ReadZSZ)” and find the appropriate the timestep, as you were suggesting on the Energy. But I find the results, as no matter if I check the Cooling or heating, the results are all on a period “1/1 to 1/1 between 0 and 23 @6”. Not sure if it’s a typo mistake on the component or the results have other purpose.

Hi @Barbarur,

When a zone has no cooling load it will simply not appear in the list. So it could be that the amount of outputs does not match the amount of rooms in your model. I already wanted to ask @chris about this issue because now it is really impossible/difficult to find out which value belongs to which room.

The sizing is done with the ddy file. This file only containes data of typical days. So the simulation is done on the timespan of one day (1/1 to 1/1) 24 hours with standard @6 timesteps per hour (look input timestep). in total 144 steps.

Hi @Erikbeeren ,

I get your point. So far, all the designs I’ve been working had loads in each room. I didn’t think on the possibility you mention. But true, that’s a problem.

The Peak Loads component brings a fast calculation. Though for knowing the value per room is still possible with the “OSM” and “ReadHVAC” components. So, the Load/Room matching is still possible, though not convenient.

About the sizing, I understand it’s done on a designed day. When using “PeakLoads”, the timespan is 21st of July for Cooling and 21st of January of Heating. But When using the “OSM”+”ReadZSZ” is 1st of January for both Cooling and Heating. Still the result is the same either way. So I’m starting to think the “ReadZSZ” has a typo error.


I Attach a file test to show comparation.

HB Energy Peak Load Double Calculation.gh (541.8 KB)

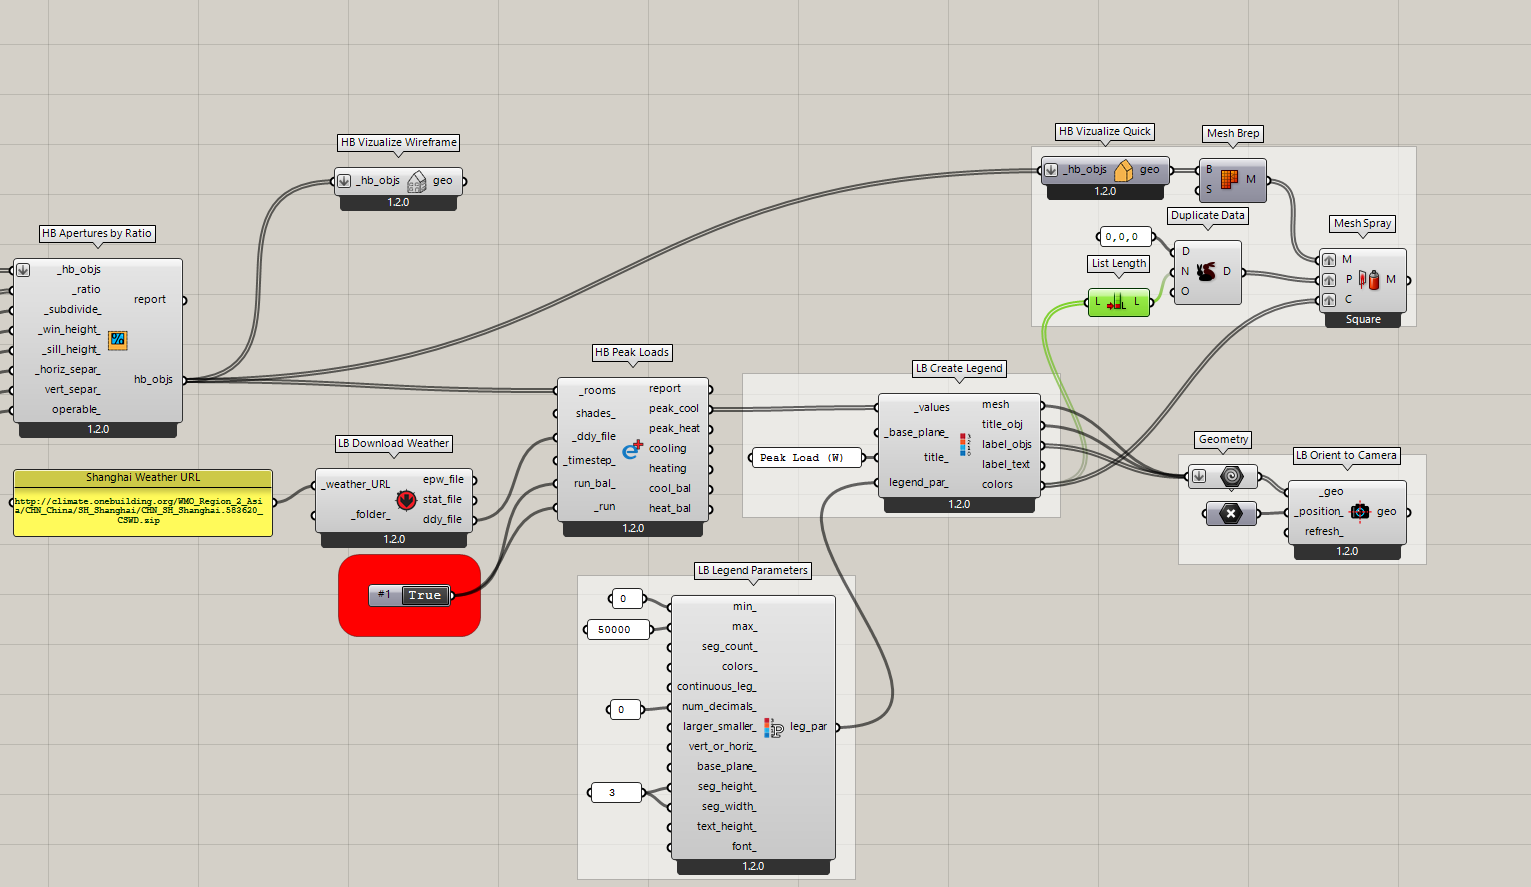
You can generate a list of colors from a list of values using the “LB Create Legend” component. So all that you have to do to color the rooms with their peak load is the following:

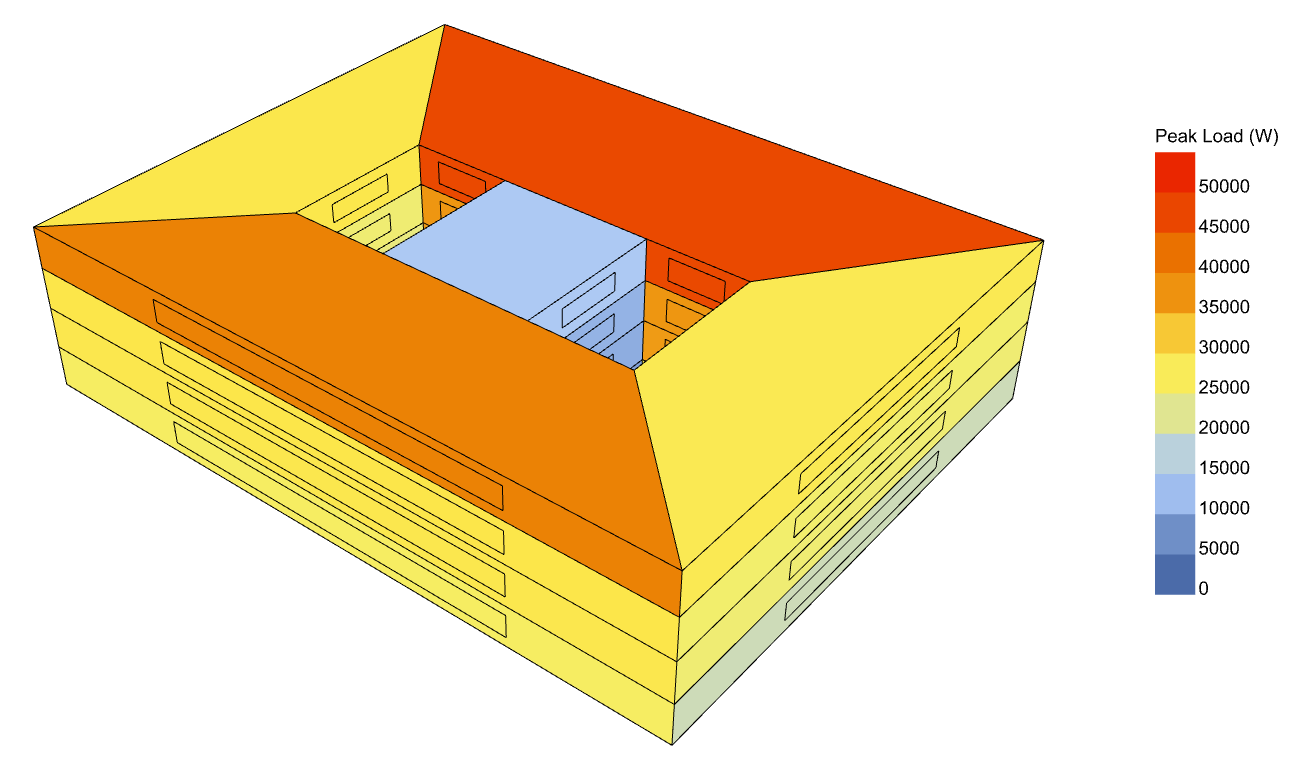
Here’s what the Rhino scene looks like:

HB Energy Peak Load_CWM.gh (77.1 KB)

5 Likes

it could be that the amount of outputs does not match the amount of rooms in your model.

Sorry that I only responded to the original tile of the post and not the current issue at hand. The incorrect date of the output from the ZSZ component is the result of the unfortunate fact that the ZSZ file contains no date information. You can set the date in the SDK layer if you really need to change it.

The list mismatch error seems to be an unfortunate side effect of how EnergyPlus works when it determines that a Zone has 0 load. I think I can implement something in the Peak Load component to ensure that you still get a 0 in the output. I opened an issue for it and I will try to address it when I get the chance:

The fix has been merged:

… and you now get a 0 in the list for any zone with no peak load:

You can get the fix it with the versioner in an hour and it will be in the next stable release.

2 Likes