Hi everyone!
I am trying to plot a chart associating outdoor air temperature and the operative temperature values with the comfort band in a 5 days time.
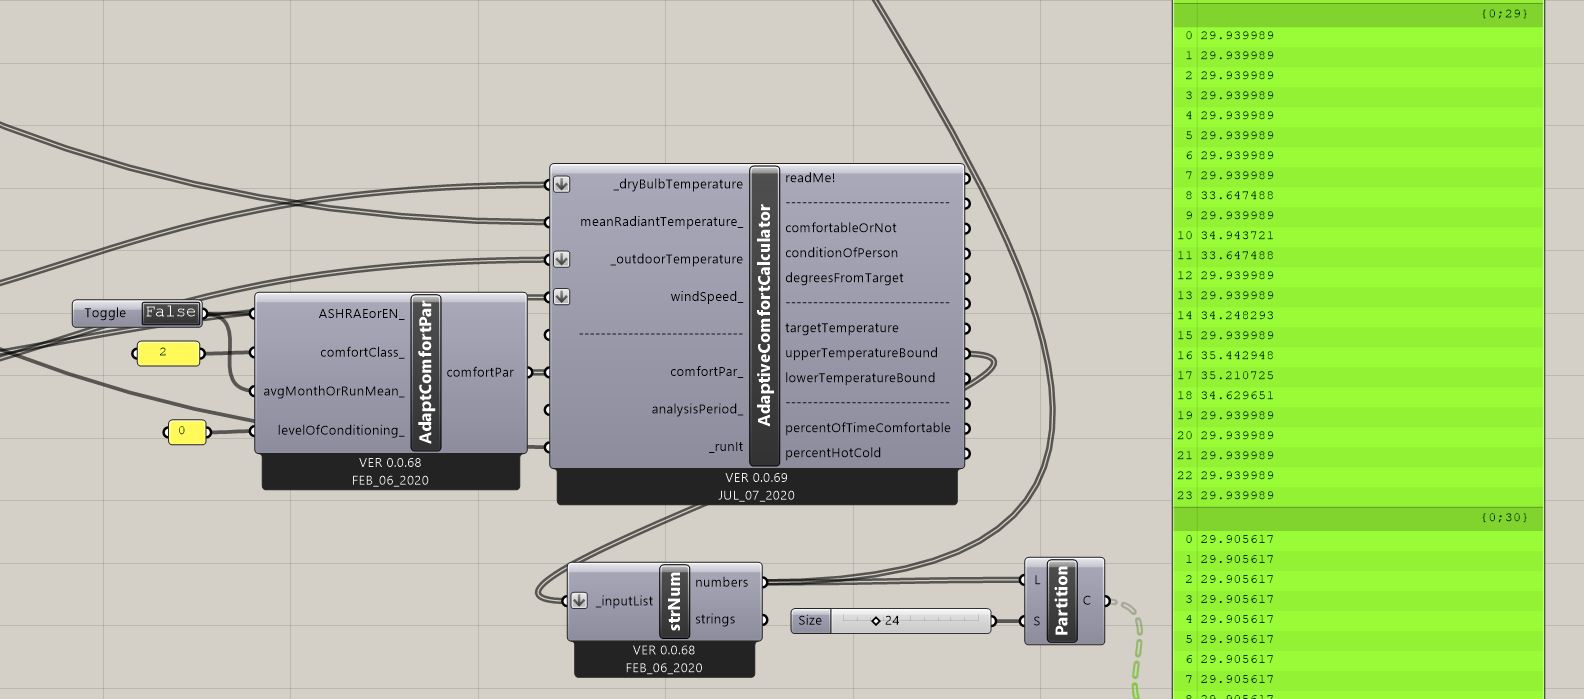
In order to do that, I need the comfort limits for each day, according to EN-15251. The problem is that the output values of the upper limits vary within a single day, which is not accurate.
Please find attached a picture of my canvas. In January 30th (29th item of the list), we get 33.64°C at 11am and 29.93°C at noon.
I was wondering if anyone else has been through the same problem and if you guys could help me solve this issue.
Thanks in advance!