My test case consists in computing through lbt-ladybug the annual irradiance on a 1m2 surface for various orientations (tilt angle from 0° horizontal to 90° vertical and Azimut from -180° to +180°).
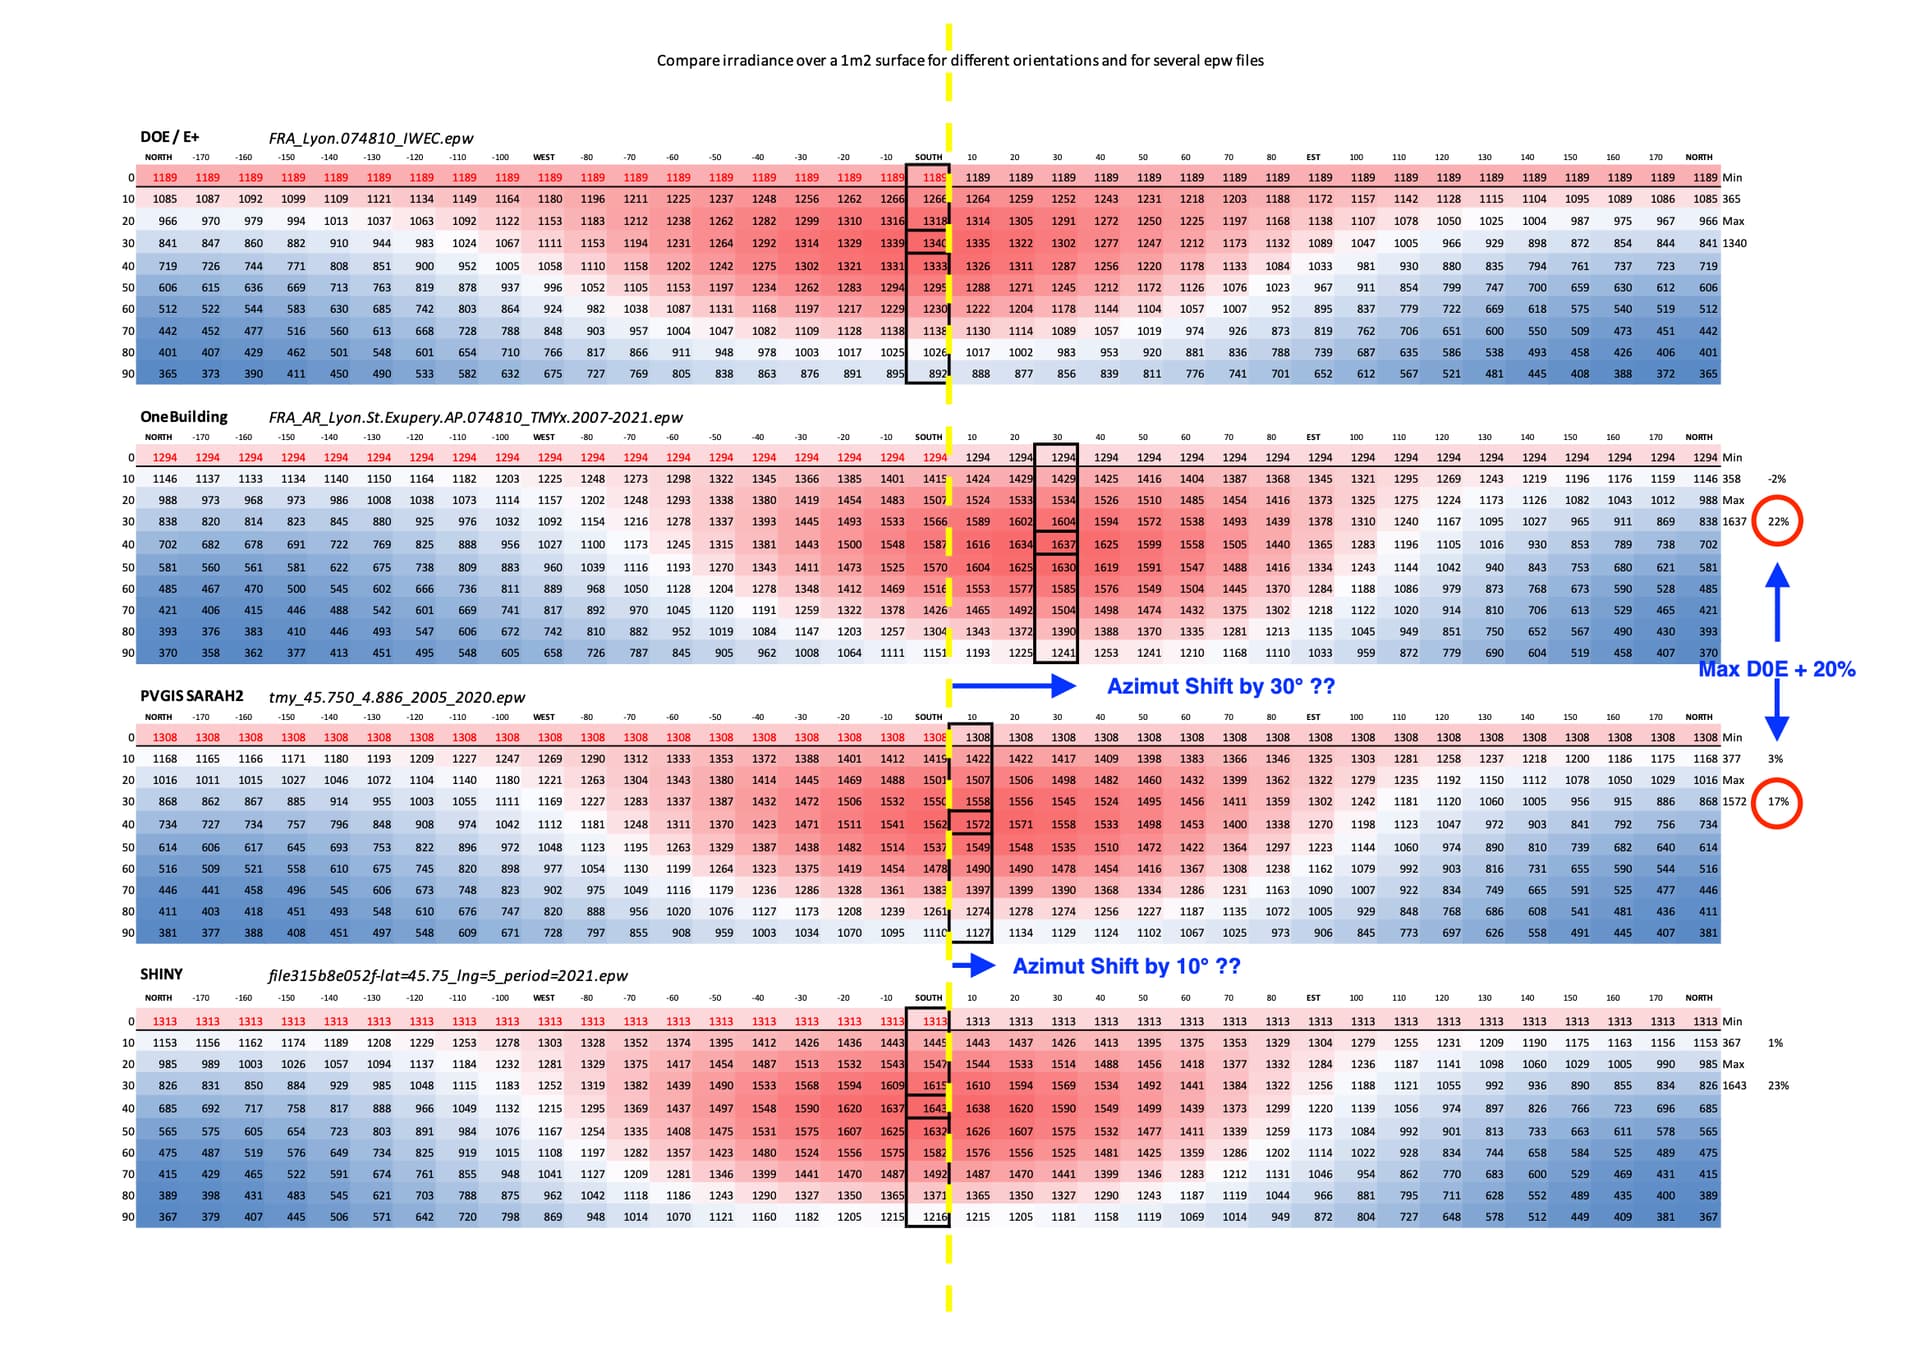
I am then comparing the plots across several epw files for the same location (cf image). But I it appears that :
the OneBuilding data are shifted by +30° in azimut angle
the DOE max irradiance (south, vertical) is about -20% less than other series (PVGIS, OneBuilding, …)
Question
can you explain this shift In OneBuilding data ?
Why in DOE data the maximum is about 20% less than in other series ? Would you say it’s in the usual tolerance or not ?
In the provider list, which one would you trust (or not trust) most ?
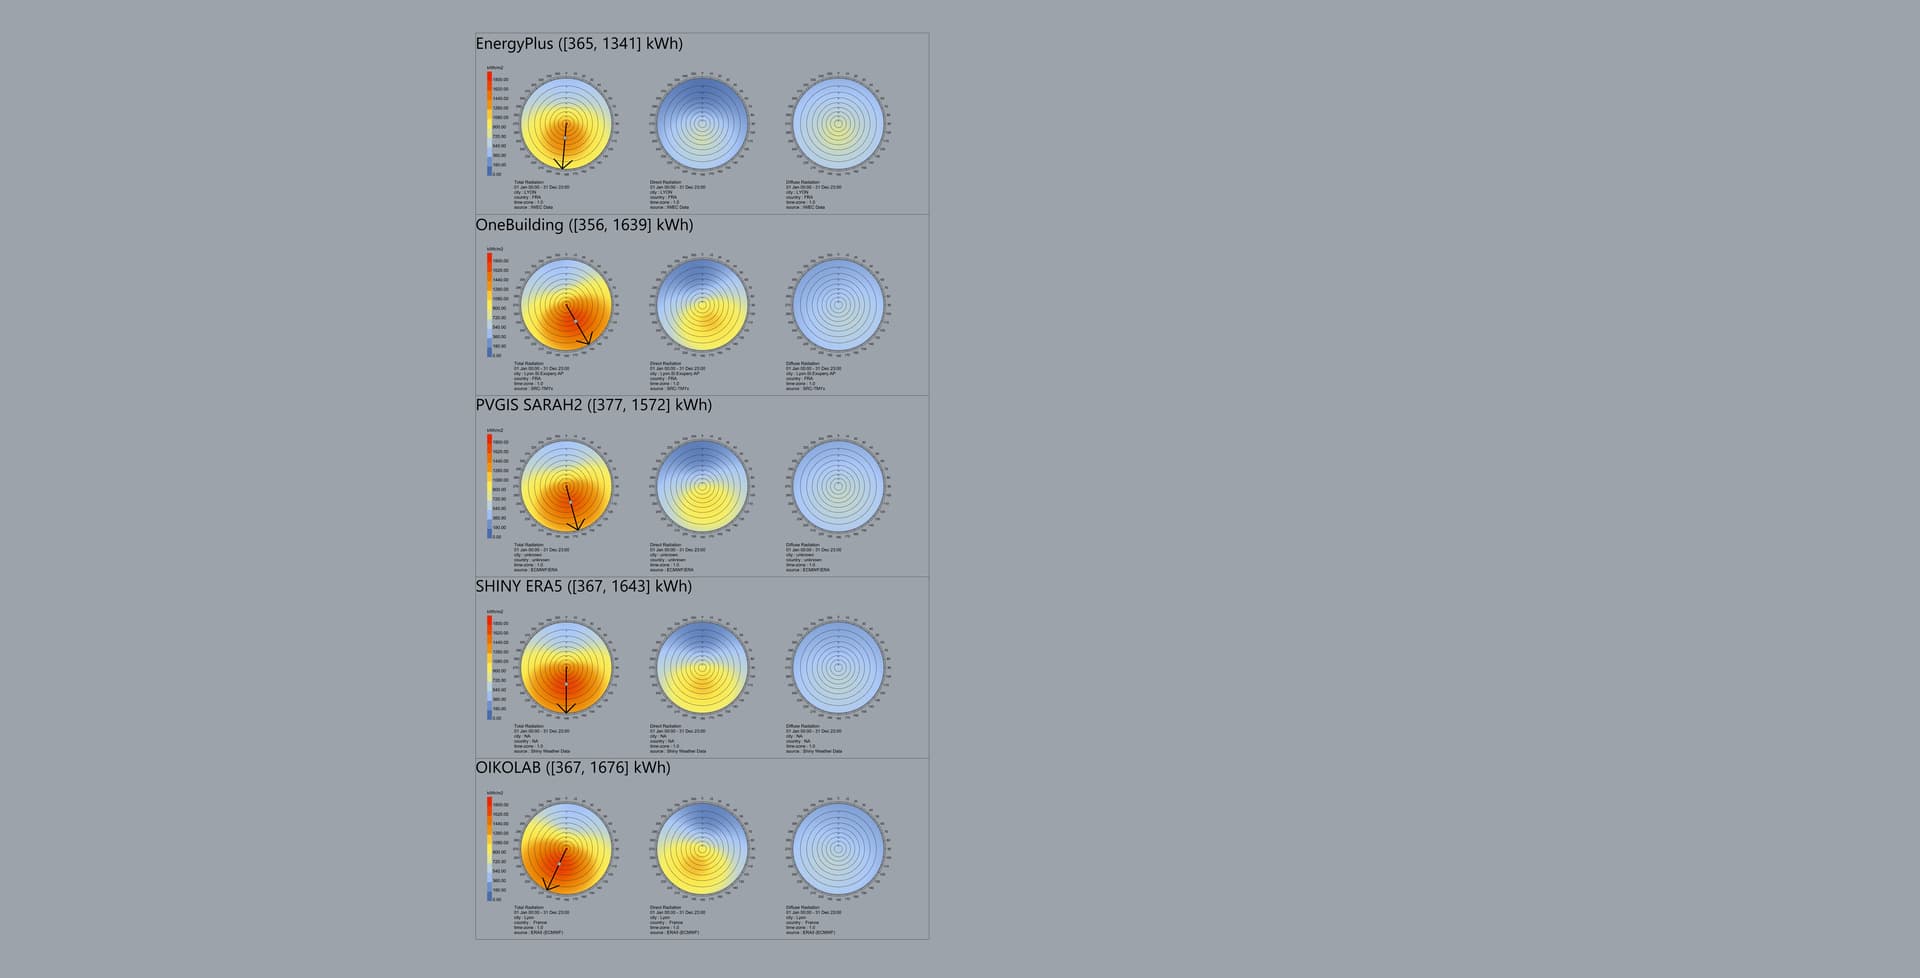
Hi @lionpeloux - how did the Oikolab data compare?
There is a lot of technical details in the data source that you’d want to consider, rather than simplly ‘trusting’ a source.
Radiation data for Climate One Building, JRC, Shiny, and Oikolab are all mostly based on ERA5 reanalysis dataset (JRC also uses NSRDB and SARAH2). We (Oikolab) provided the raw ERA5 data to Climate One Building but not sure how the data was compiled into EPW file.
Note the EnergyPlus file for Lyon is mostly from 1980’s and early 1990s. Radiation data is not measured by weather stations, so these radiation values were probably empirically calculated, which leads to a lot of inconsistency. We generally recommend against using them, also because they are really outdated; the dates fall outside of the 30 year NOAA climate normals (1991-2020).
In general, I’d recommend going with a dataset that can provide traceability to the source data and the derivation method so you can verify things yourself.
Thank you for your advice. I didn’t get the chance to test a single TMY file from oikolab as it is a paid service (at this point this is only a side project for me).
Is there any chance you can share me such a file for Lyon in France so I can compare ?
I did try you service but received a 25$ bill before getting any full epw file
Thank you for providing a test file from Lyon, France.
Here is the updated comparison. Your file seems shifted in the other side compared to OneBuilding.
Do you have any though on that ? Am I missing something ?
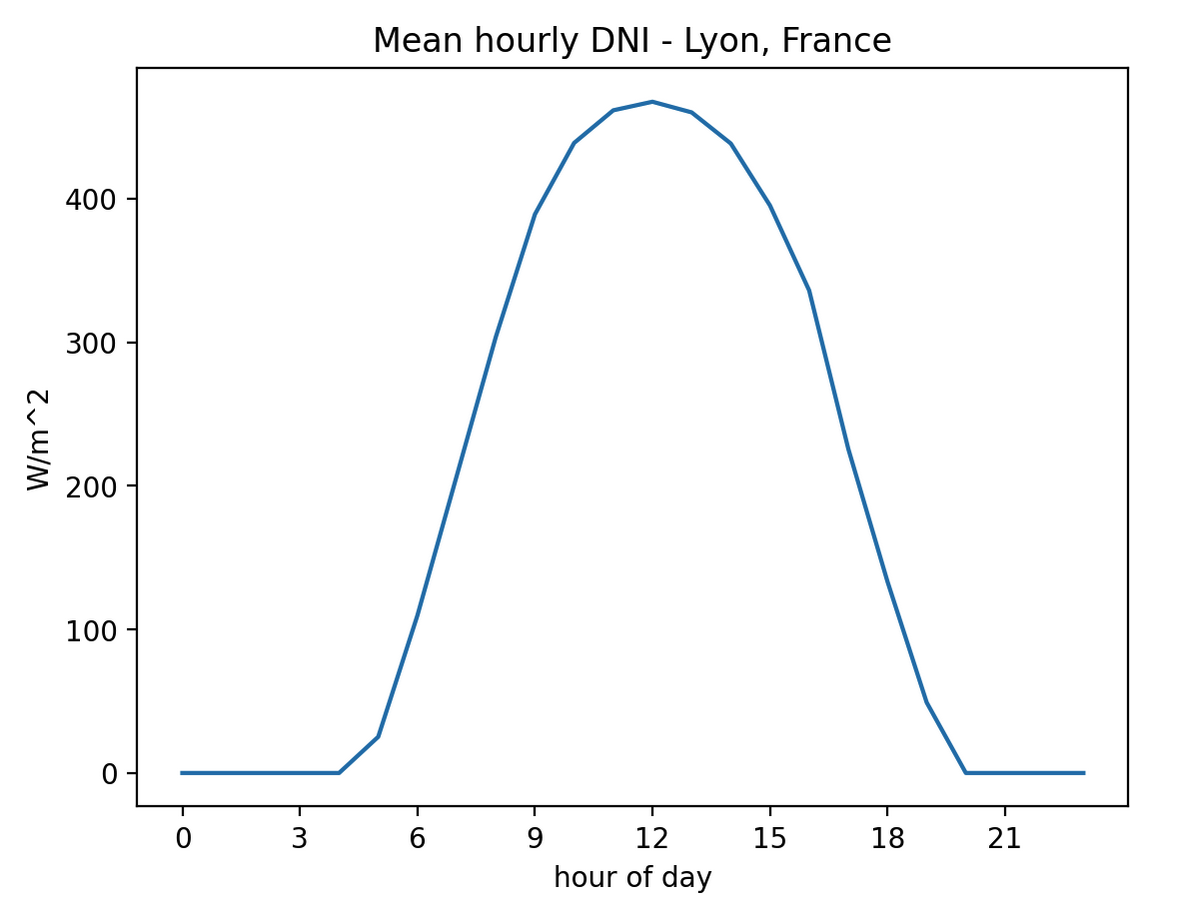
Yikes - not sure how that happened. How’re you calculating the direction? The EPW file doesn’t specify solar azimuth direction and I just checked to see DNI mean value peaking around noon (2010 to 2022) for this location below so I’m a bit curious to know what happened.
Basically, this compoent is doing the same thing as my initial script, that is: computing solar irradiance on a surface for all azimuth and inclination angles. The difference is that in the rose component results are “rolled up” 360° wide.
As you can see, results look very similar to my first version, in terms of azimuth, min and max values.
As you pointed out, the DOE file is much older. It can explains the difference in magnitude comparing with the 4 others, which are all reconstructed from satellite based data. These last 4 epw exhibit the same “pattern” so it sounds consistent to me.
But still, why such an “azimuth” offset ? Can the underlying problem be a shift in date time, like some weird timezone interpretation ? Do you have any explanation ? Note also that OneBuiding is shifted the opposite way comparing to Oikolab.
Maybe @chris or @Lukas might be able to share their thoughts on that ?
The radiation domes that @lionpeloux is showing just involve passing the EPW location and radiation data through the Radiance gendaymtx function. So the Radiance function is figuring out where the sun is in the sky based on the latitude, longitude and time zone information in the EPW file.
I would recommend that @lionpeloux check the location information in each of the EPW files to make sure that the time zones are all the same across the files. If so, then we know that the radiation data in some of the EPW is likely not coordinated correctly with the time zone.
Maybe the radiation data was output assuming solar time or something like that. Or maybe daylight savings time is just messing everything up (it certainly wouldn’t be the first time daylight savings created a mess).
I had one more thought about what could explain the shifted radiation, which is that some of the EPW sources might not have correctly interpreted the idiosyncratic convention of EPW radiation.
That is, the radiation value specified for a given time in the EPW is meant to be the cumulative radiation over the previous hour and not an indication of irradiance at that specific time point. I know I misinterpreted this a bunch at first myself when I was first starting to work with EPW.
@chris - yeah, I think that might be it. I think this radiation definition is not applied consistently, whether it’s meant as instant value at that time or averaged over the previous hour. I think the official definition is meant to be for the previous hour but it’s actually treated like an instant value in many places. I had some emails back and forth with Linda & Dru about this a while ago on this exact topic too.
FYI, one thing that I did in my calculation is when calculating the illuminance, I calculated the mean solar angle by taking 30 min offset, something like this:
Joseph and Chris already covered all pitfalls, but usually bowls down to handling time (including summertime) with care and that some sources use time-cumulative while other uses instantaneous values.
Good practice making these kinds of roses. EPW-files with such errors can be corrected by manually altering the time zone or longitude information (better alter the longitude if other weather data is believed to be recorded with appropriate timestamps).
Thanks for your insights. I’ve checked the time zone and it is consistent across all files.
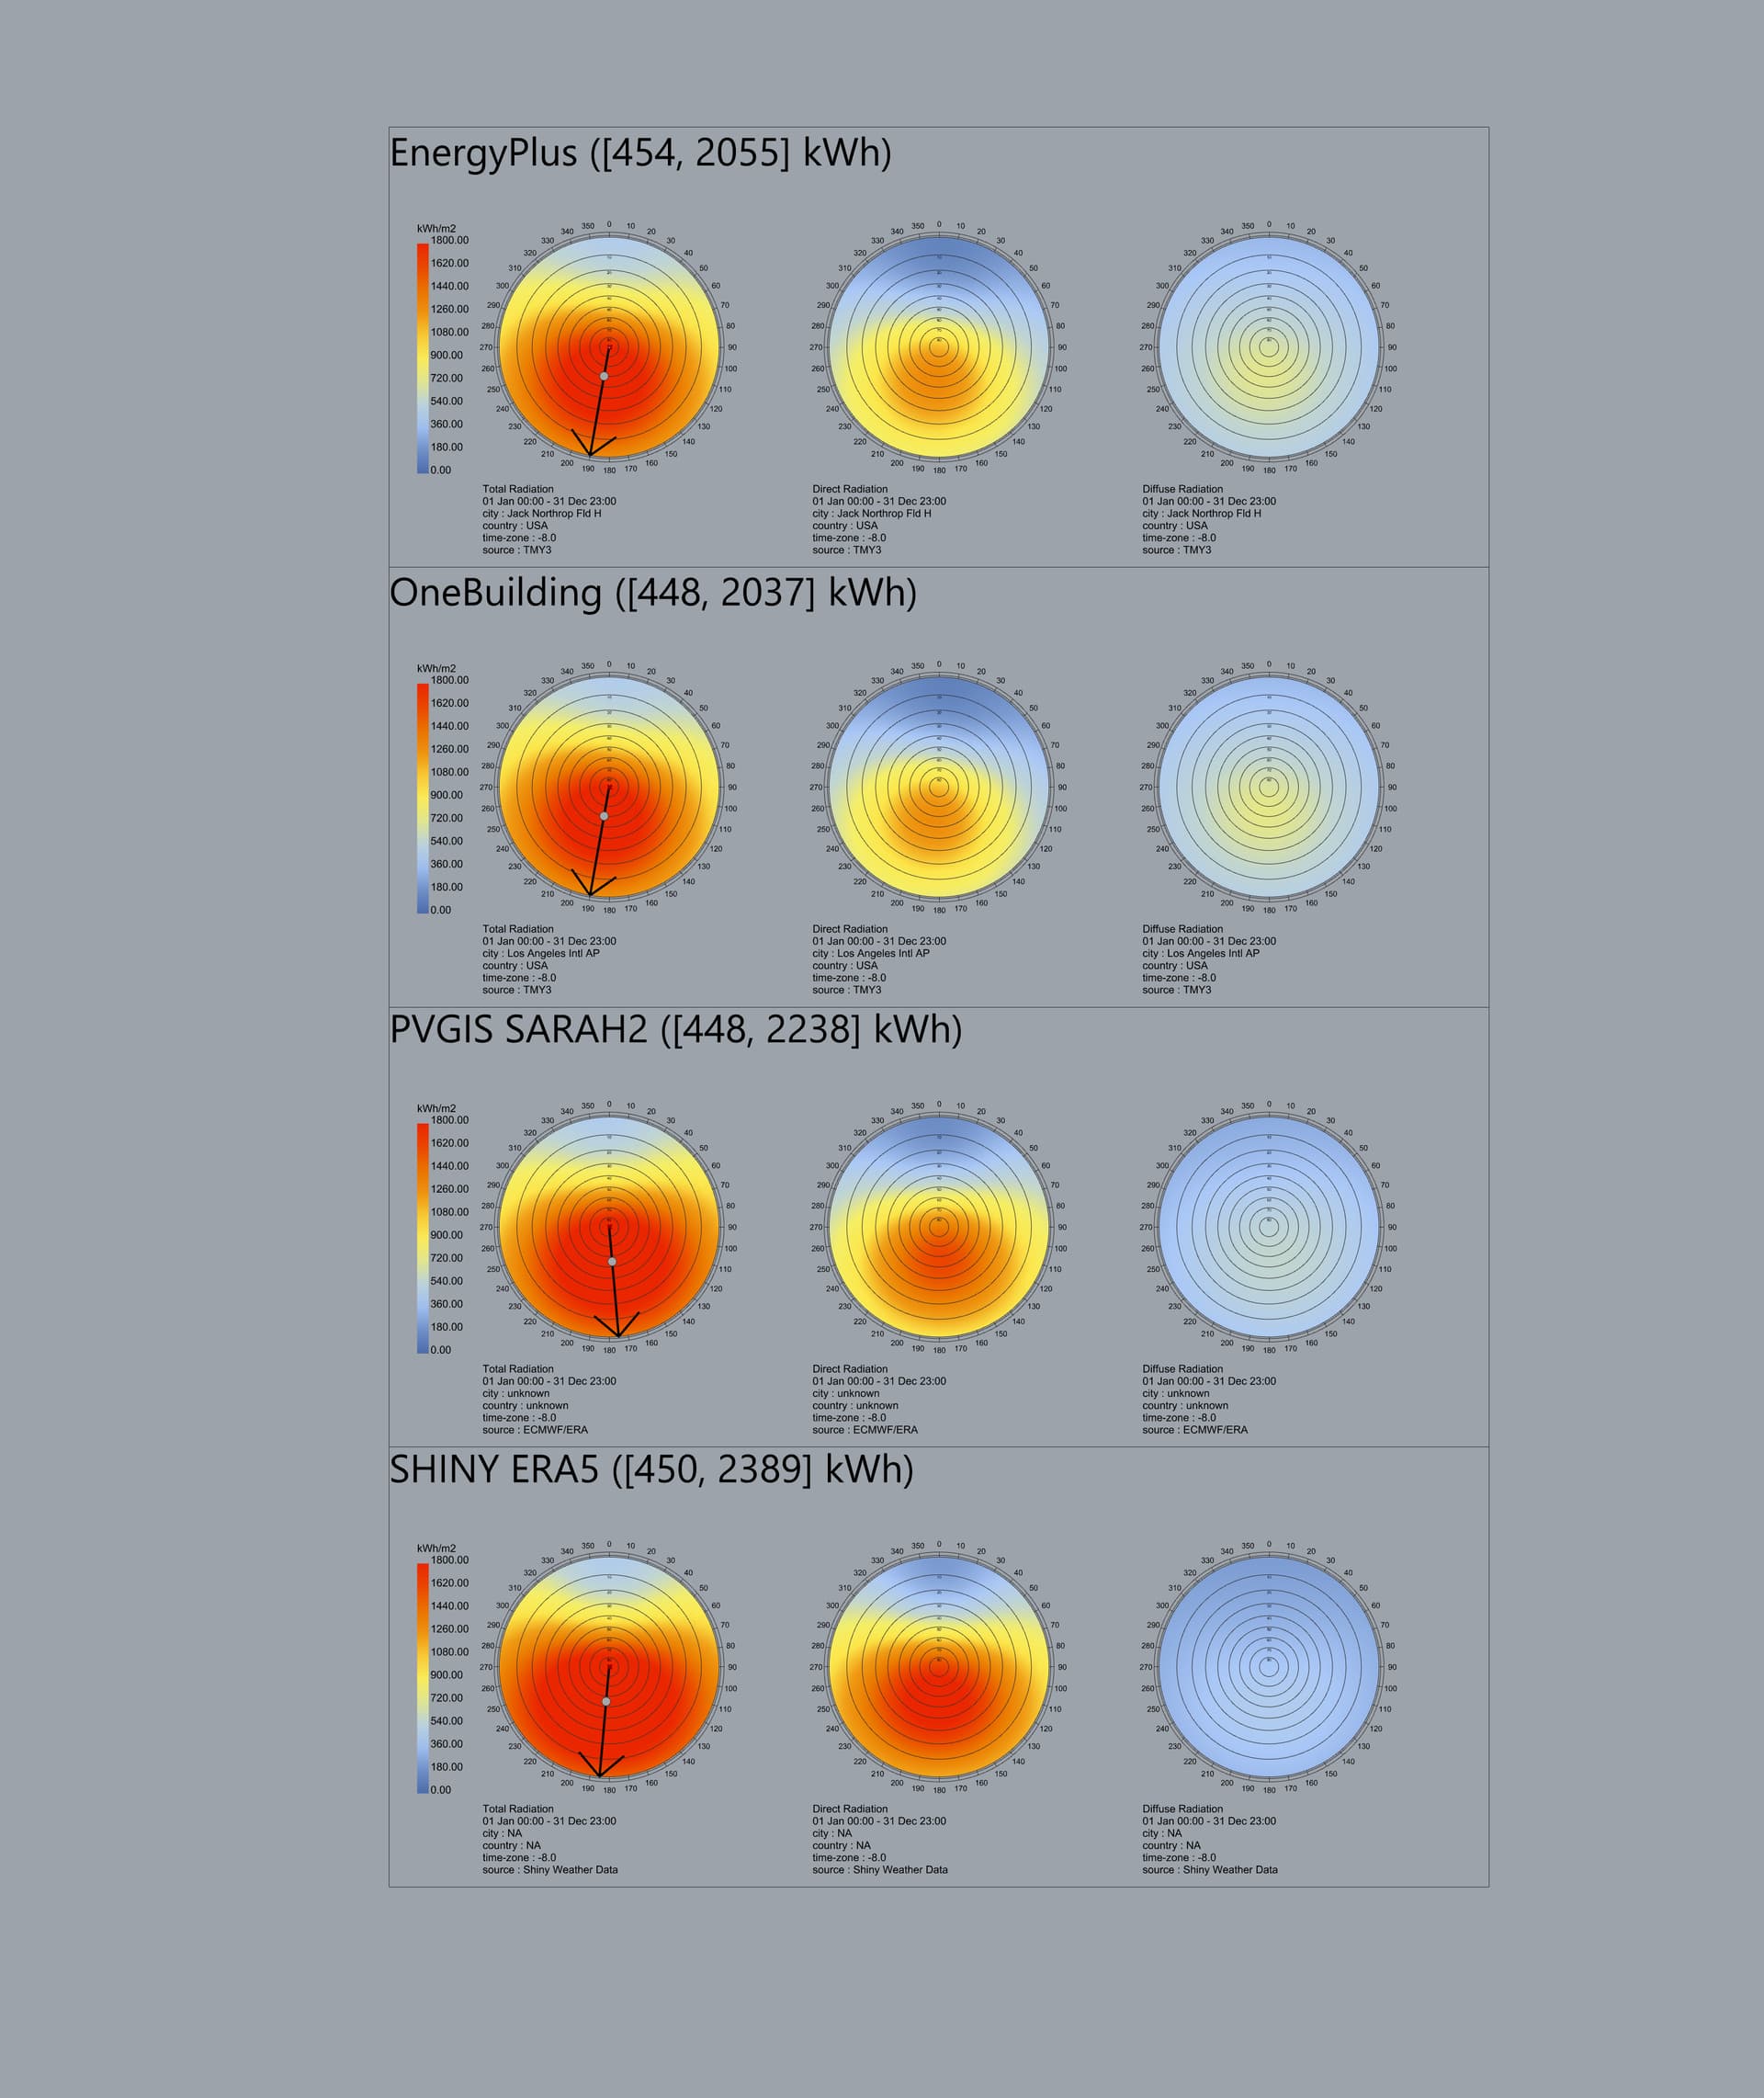
I’ve done a new comparison fo a different location (Los Angeles, USA) and results look more consistent (see image below).
Is there a reference document you would recommend for understanding how TMY are built ? Specially about this “cumulative radiation” question.
Which TMY/EPW provider would you recommend to design “real life” projects ?
Interesting to hear that you think this might be it:
But this does seem likely given that a half-hour offset looks consistent with those images of Los Angeles, @lionpeloux .
I know that it’s idiosyncratic and counter-intuitive to record radiation as a “total over the previous hour” but this is how EnergyPlus interprets the EPW radiation from the file and, considering that EPW was originally created for EnergyPlus and stands for “EnergyPlus Weather,” it seems pretty clear that this is the standard that EPW files should follow if they are to be considered valid.
If you want the official document that states this, @lionpeloux , you can see the description of the Radiation Fields in the EnergyPlus Docs here:
Field: Direct Normal Radiation
This is the Direct Normal Radiation in Wh/m2. (Amount of solar radiation in Wh/m2 received directly from the solar disk on a surface perpendicular to the sun’s rays, during the number of minutes preceding the time indicated.) If the field is “missing ( 9999)” or invalid (<0), it is set to 0. Counts of such missing values are totaled and presented at the end of the runperiod.
FYI, Radiance is thankfully very flexible in the way that you feed the radiation data to it and Ladybug does something very similar to this when it formats the EPW radiation for Radiance functions:
@Lukas 's suggestion of adjusting the time zone could be a suitable workaround for running correct Radiance simulations and producing visualizations like the radiation dome but I wouldn’t recommend this for EnergyPlus simulations. For that, you can build a new EPW with the hourly Radiation changed using the DF Create EPW component. You can shift the radiation values by a half hour using the LB Convert to Timestep to do a linear interpolation between the hourly values. Then deconstruct the data collection ad build a new hourly radiation data collection using every other value in the data collection.
Shifting the longitude information with 7.5 degrees has the same effect as doing a half hour time shift interpolation on the radiation variables and easy to do when you need to get instantaneous radiation values onto the right azimuth angle. But yes, it’s hack best employed when you just care about getting things up and running.
@chris - imagine a location on equator where solar noon coincides with solar noon, so that sun rises at 6am and sets at 6pm every day. Under the EPW definition, the solar radiation value at 6am would be zero (no sun between 5am - 6pm, mean solar angle below horizon) whereas the value at 6pm will be non-zero (sun between 5pm - 6pm, mean solar angle above horizon).
When plotted, this might seem like the radiation data needs to be centred somehow but it’s actually correct according to the definition. Linda mentioned something about centering radiation data also but I thought per actual EPW defintion, the radiation value will probably look like it’s skewed if done correctly.
solar irradiance is the power received by a 1m2 surface at a given time stamp (in W/m2)
solar irradiation is the energy received by a 1m2 surface at a given time period (in Wh/m2)
however, in practice these terms are often confused …
In the EPW format documentation you referenced (here) it is clearly stipulated that:
Direct Normal Radiation is the amount of solar radiation in Wh/m2 received […] during the number of minutes preceding the time indicated.
This is aligned with the TMY3 specification (here) :
Direct normal irradiance is the amount of solar radiation in Wh/m2 received in a collimated beam on a surface normal to the sun during the 60-minutes period ending at the timestamp.
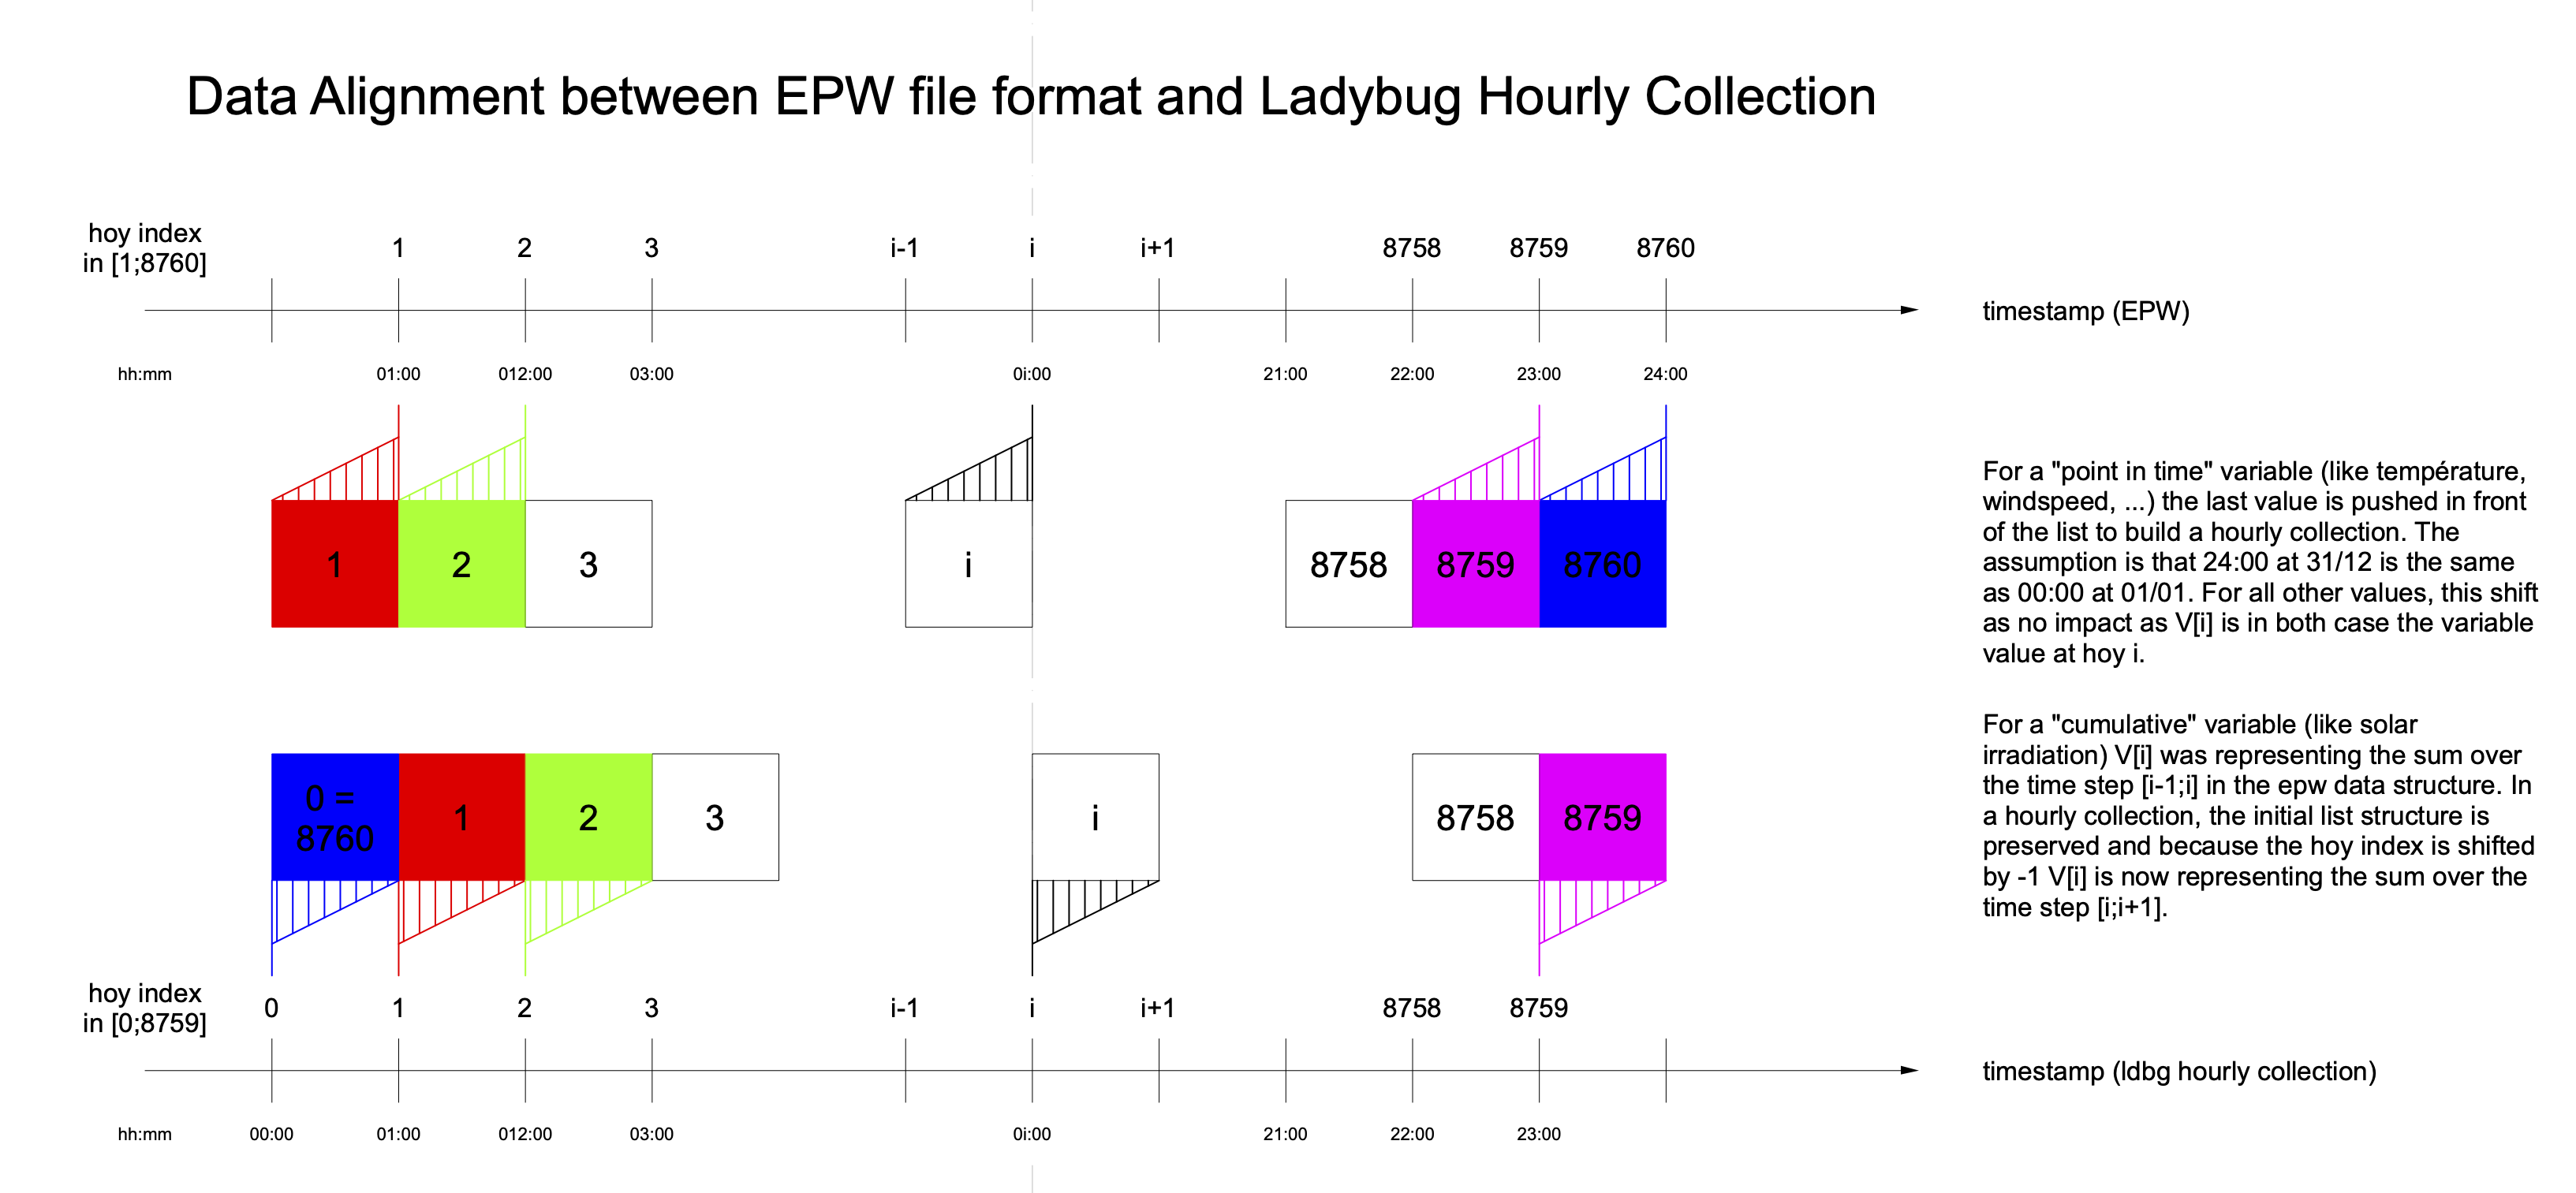
In the docstring of the epw.py module it is written that the last time stamp in the series are forwarded at the beginning of the series.
This is how I interpret the comment : would you conform it’s correct ?!
12:00 datetime in the hourly data collection represents the accumulated radiation in between 11:00 and 12:00.
But because internally in LDBT there is a shift of the time stamps of one hour ahead of time (24:00 the 31/12 is pushed to 00:00 the 01/01) to conform to DateTime standard (where 24:00 does not exist as time goes from 00:00:00 to 23:59:59), now in LDBGT :
12:00 datetime in the hourly data collection represents the accumulated radiation in between 12:00 and 13:00.
So because of this shift :
A “point in time” data (like temperature, wind speed, wind direction, …) is still represented by the same timestamp (but 24:00 of day N is now 00:00 of day N+1)
An “accumulated” data (like radiation) over an hour is now represented by the timestamp opening the period (while it was represented by the timestamp closing this period in the epw file).
This Is what my figure was trying to illustrate and I think this is in accordance to what is explained in the docstring of the EPW.py module.
Does it make sens to you ?
Hopefully @chris can confirm (or not) if may explanation is correct.
From what I understand… I think I would have suggested against doing this.
This essentially changes the meaning of the data by shifting the timestamp of radiation parameters, which creates all kinds of confusion like we have in this thread.
If the radiation parameters from the last step were treated like other parameters, I think it would have been less confusing. In most cases, they would be all zeros anyhow.
Hi @lionpeloux - did you get any clarification on this? FYI, we’ve updated how EPW files are charged so you can now download TMY files for the same price as AMY (both set to 250 units - this should allow up to 6 free AMY/TMY file downloads per month). I’ve cleared your account so feel free to try to download again if you’d like to do more comparison.