Hi there,
I’ve juste released a set of components that I want to share. It is bundle in a simple grasshopper plugin (download here). Learn more here. Ask Q&A here.
What you’ll find :
-
PVGIS wrapper : access all PVGIS functionalities directly into grasshopper to make your solar/PV analysis. You can also download TMY in EPW format. PVGIS provides information about solar radiation and photovoltaic (PV) system performance for any location in Europe and Africa, as well as a large part of Asia and America. PVGIS can help you assess PV electricity generation potential for different technologies and configurations. See here for API specifications.
-
Weather Data Files : in my quest of valid AMY/TMY .epw files for building energy modelling, I came through coding 2 components that can index all the weather data files provided by EnergyPlus.Net (DOE) and Climate.OneBuilding.Org. You can then filter these data spatially (for instance to find all data around a given location within a given distance) an by keywords. You can then download the files to your hard drive with the appropriate IO component.
-
File IO : a bunch of components for working with files. Includes a component to fetch files from a web url.
Hi Lionpeloux
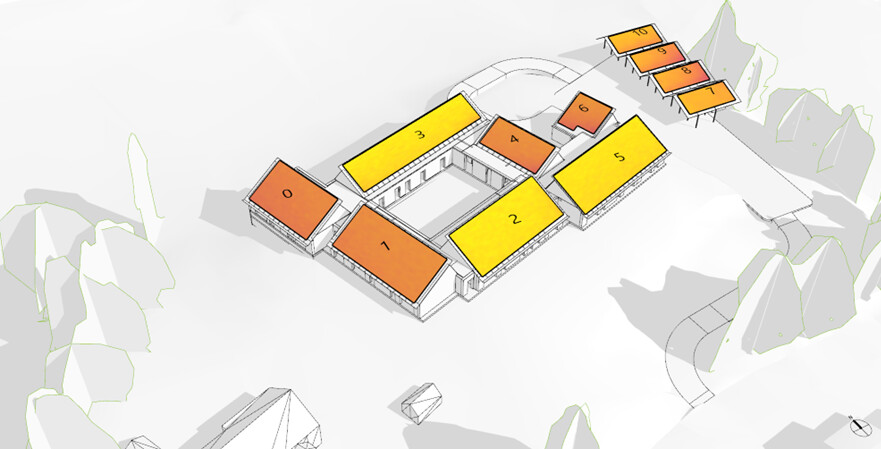
This looks really great, nice work! I’m thinking of testing out the potential of your components and PVGIS in grasshopper by testing them out on a project I’ve been working on. The building has various roof angles that each have different shading situations from self shading and the surrounding trees. Would you recommend creating a horizon (with the ladybug shading mask for example) for each roof surface and then input this along with the azimuth and inclination for each surface as a list?
<
I am then wondering about the timestep with which PVGIS calculates at and your total outputs component. Is it possible to get hourly values as an output?
Once again great job and thank-you in advance for any advice.
Donald
Hi @DonaldOtterson1,
Maybe you can start with no horizon at all (first) and add it later on, when you know you are happy with the components and what PVGIS offers to you in terms of results/analysis.
But yes, if you want to fine-tune your analysis, I would go for a custom horizon/mask for each PV zone computed from your own context.
I recommend that you look a the online tool : JRC Photovoltaic Geographical Information System (PVGIS) - European Commission.
The components are just doing the same things right in GH (by calling the PVGIS REST API).
So yes you can get hourly data for radiations. You can also resort on daily/monthly values (see the specific tools) which are under-the-wood aggregated from hourly data (this will be a bit faster though as it involves less data transfert).
Let me know how things are going for you on this topic !
Hi again
Thanks for the suggestions, I will look into this when I get the time and get back to you if I have any more questions.