Hi.
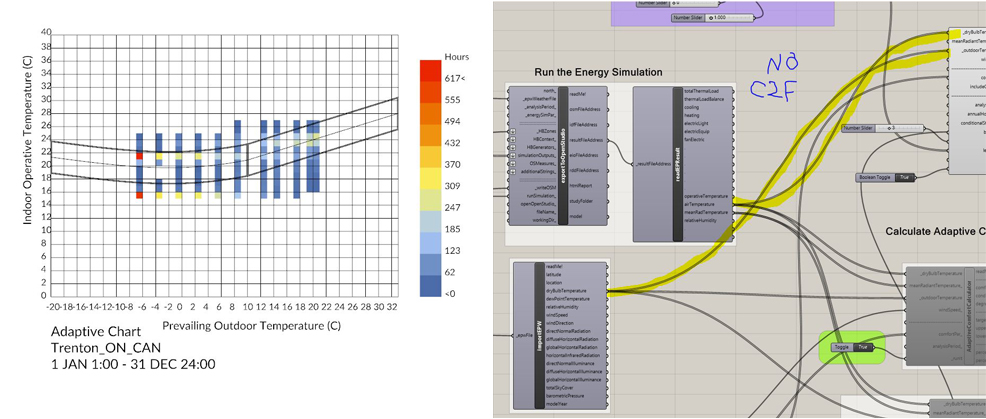
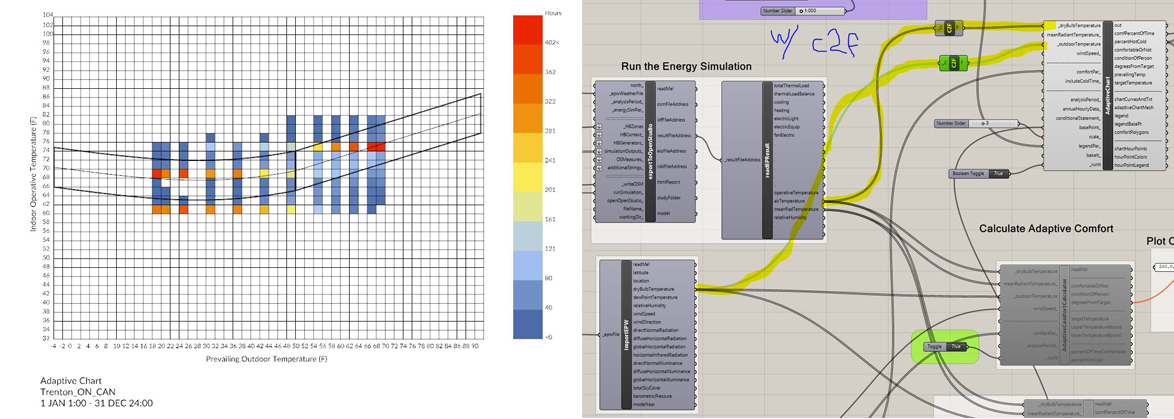
I am currently creating an archive of Ladybug Adaptive Comfort Charts for a number of weather file locations. I have already run the set successfully, now I want to rerun the file set this time, but with the chart’s legend converted to imperial units, so, for the most part, converting the x&y legends- from Celsius to Fahrenheit. I tried completing this by using the c2f converter in the wires that connect to drybulb temp. and outdoor temp. of the Adaptive Chart block from the importEPW block, and this partly works because the legend units displayed in the Rhino window do change over to Fahrenheit. The problem is that the hourly scale also changes when I do the conversion–which is odd, right? Shouldn’t the hourly scale remain the same no matter the units, since they indicate the # of hours which the temperature is comfortable or not, which as far as I understand would be a non-negotiable ratio, since its a set value which determines a person’s comfort? Also, I noticed the Adaptive Chart block and other ladybug charts emphasize in their structure that the information they output will be in Celsius unless otherwise indicated with an “F” in an earlier input, which I assume means an epw file that is in Fahrenheit. So, not sure which path to follow to get a correct imperial Adaptive Comfort Chart settings which could run multiple weather files; is it that there are missing or incorrectly placed unit conversion blocks that would correct the hourly scale, or do I need to figure out a way to convert an epw file, from its standard Celsius setting to a Fahrenheit format, so from beginning to end they ladybug analysis is working in a single temperature unit?