Is there any method of defining only the occupied hours for the “LB comfort statistics” component?
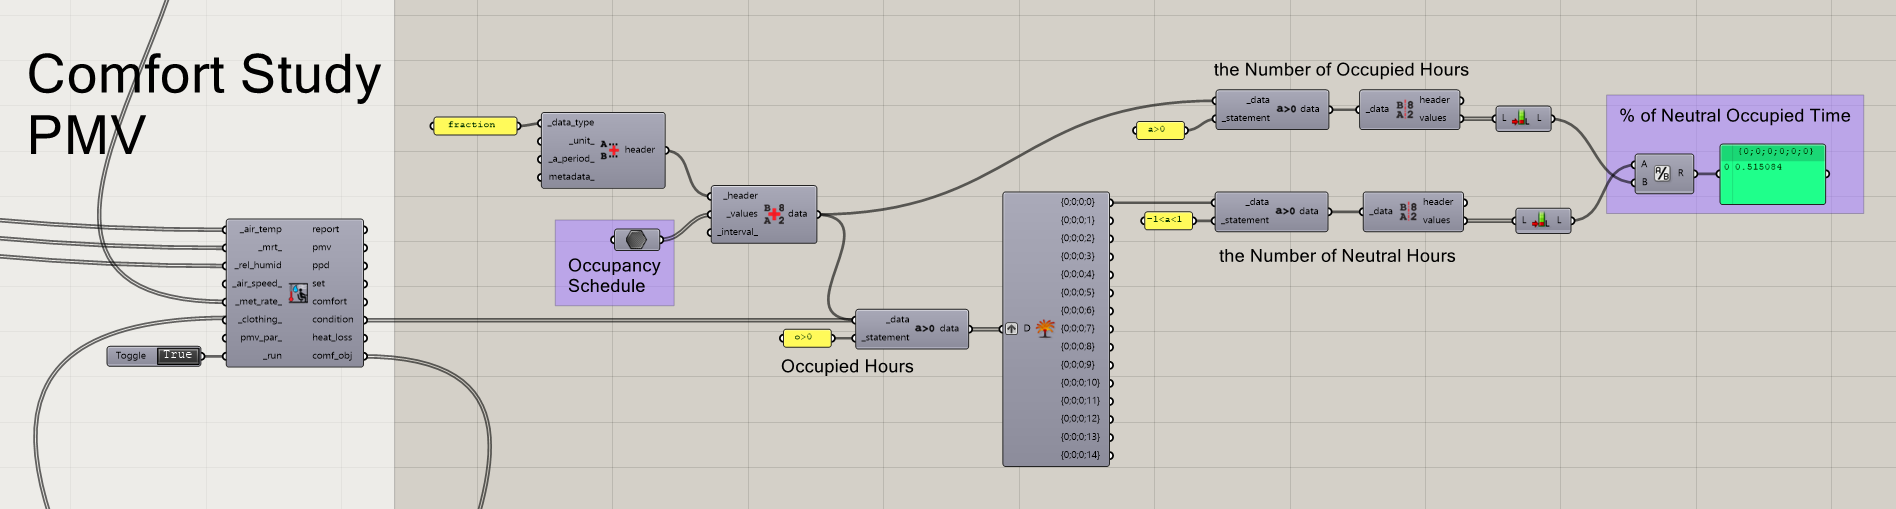
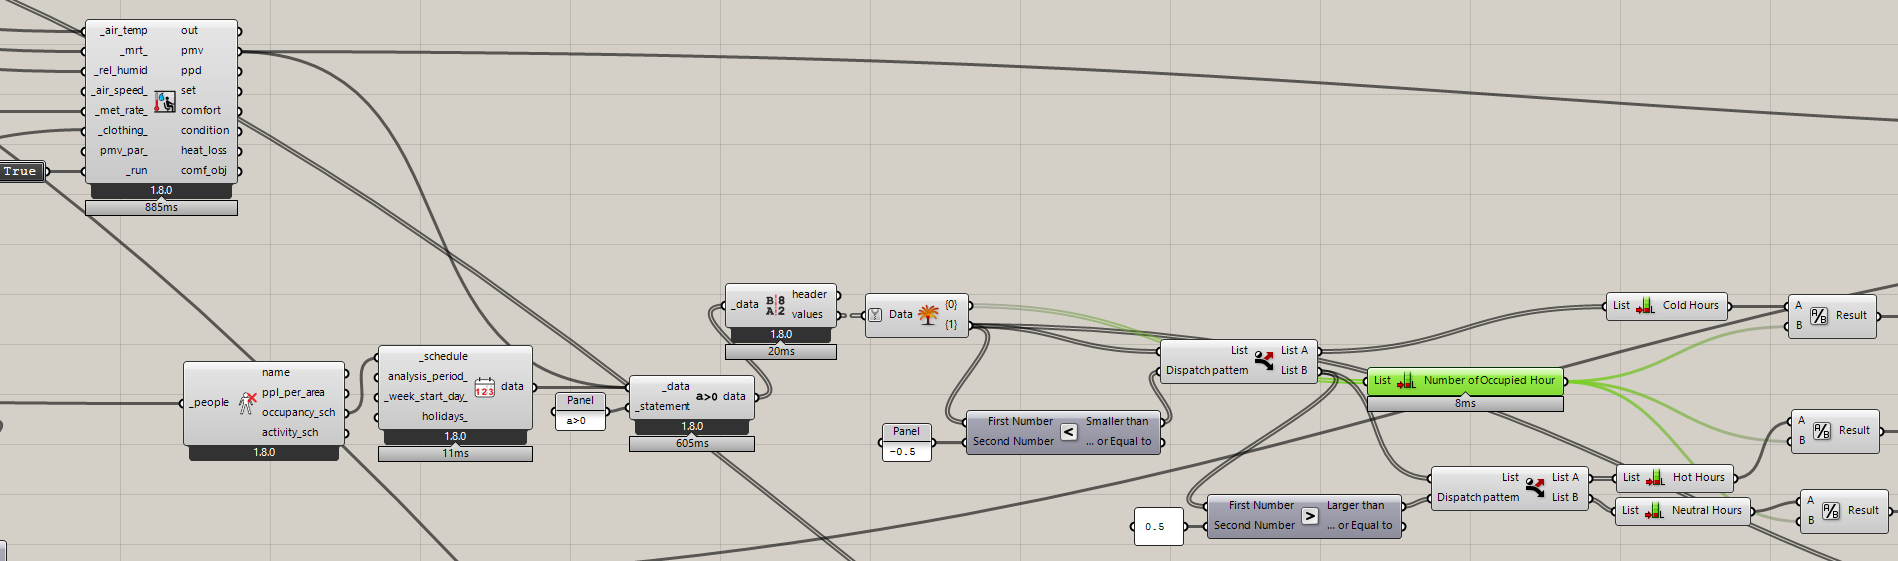
The zone I’m trying to run a thermal comfort analysis for is empty at times. So, I created a 8760 value data of met rate (with some values being 0 due to not anyone being present at that zone at those hours) and connected it to the “LB PMV comfort” component and reasonably, what I got was a lower percent of neutral times compared to a met rate data with no 0s.
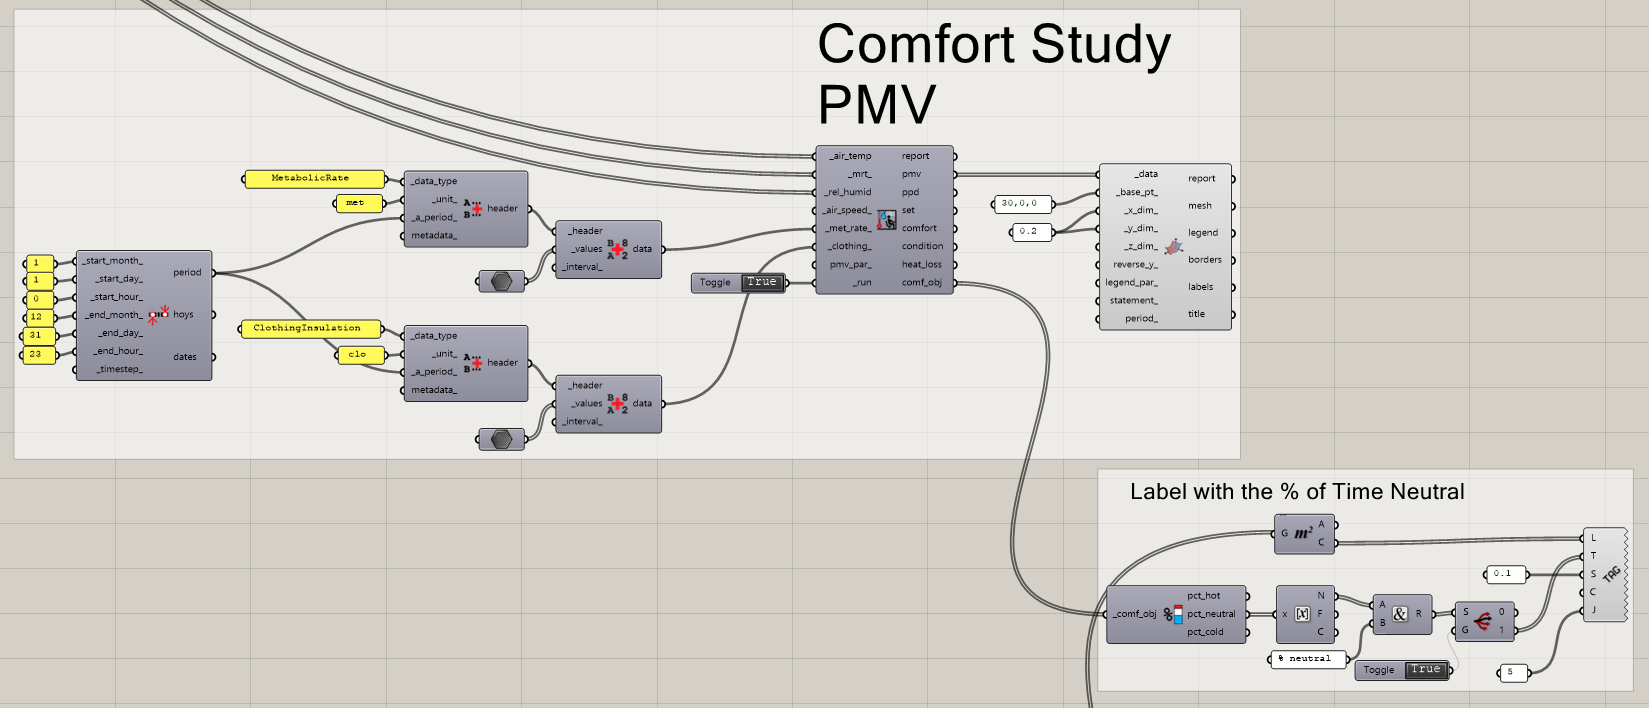
what I’m interested in is finding out the percent of neutral “occupied” hours only.
ps: I read about applying a conditional statement to the visualization component to get rid of the unoccupied hours in a similar topic in the forum, but this only eliminates the unoccupied hours in the 3D chart and does not affect the calculated percent of hot/neutral/cold time.
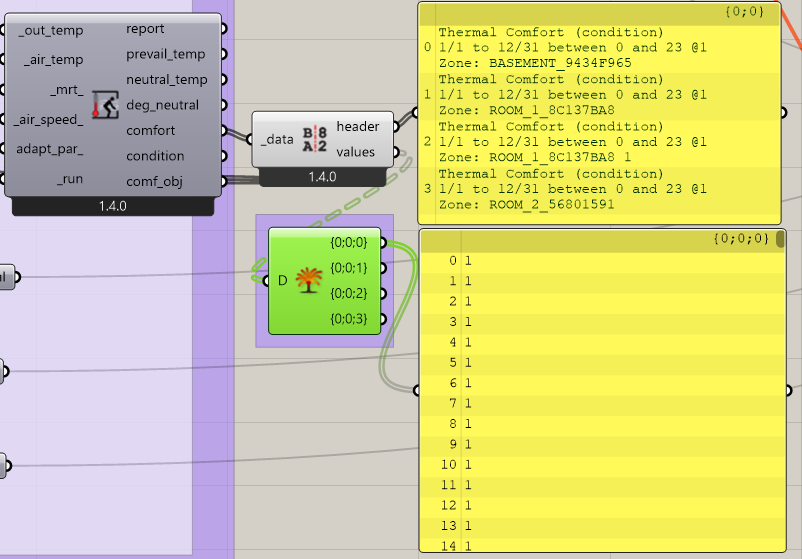
interesting! I would like to do something similar and keep the comfort values for the whole year but only between 7am and 11pm. Now, I have a list for each room of the values for 8760 hours of the year.
Is there an easy way using LBT components to substitute the occupancy schedule in your graph to specific hour ranges (excluding night hours for the whole year)?
You have the right idea, @AbrahamYezioro . The analysis period should be applied on the data collections before they get input to the PMV component. Then, the comfort object will show stats for only the analysis period.