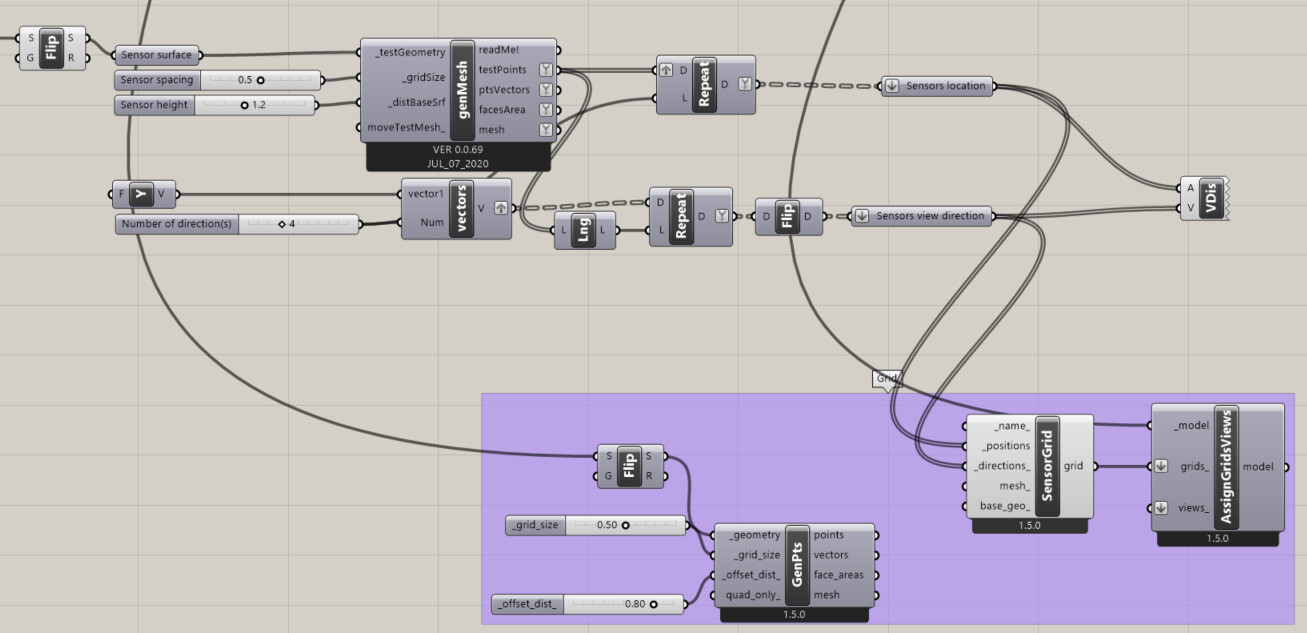
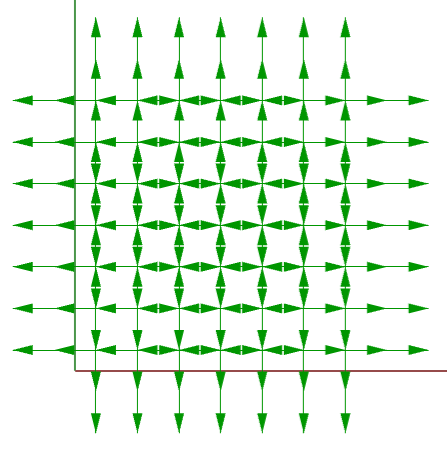
The vectors are not completely correctly placed (I want to have per grid point pointed at N, E, S and W). Also, in the simulation results the direction is not taken into account (same output for each grid point 4 times).
Does anyone have experience with this and would be willing to help?
Thanks, this is a much easier way to do it indeed!
I have one more question; Is there a simple way in which I can see which vector represents which row in the output DGP files? Sort of labelling the vectors?
I furthermore get this error: 1. Solution exception:‘str’ object has no attribute ‘X’
when I try to use the annual to data component and connect the vectors to it.