I was wondering if you could send any link to show the interpretations of what the detail contents inside each of specific schedules so we could make an adjustment to other region`s protocol. Like the pic shown below, by typing in apartment key word, there are lots of options pop put, how could I differ the content?
Hi @TrilithStone ,
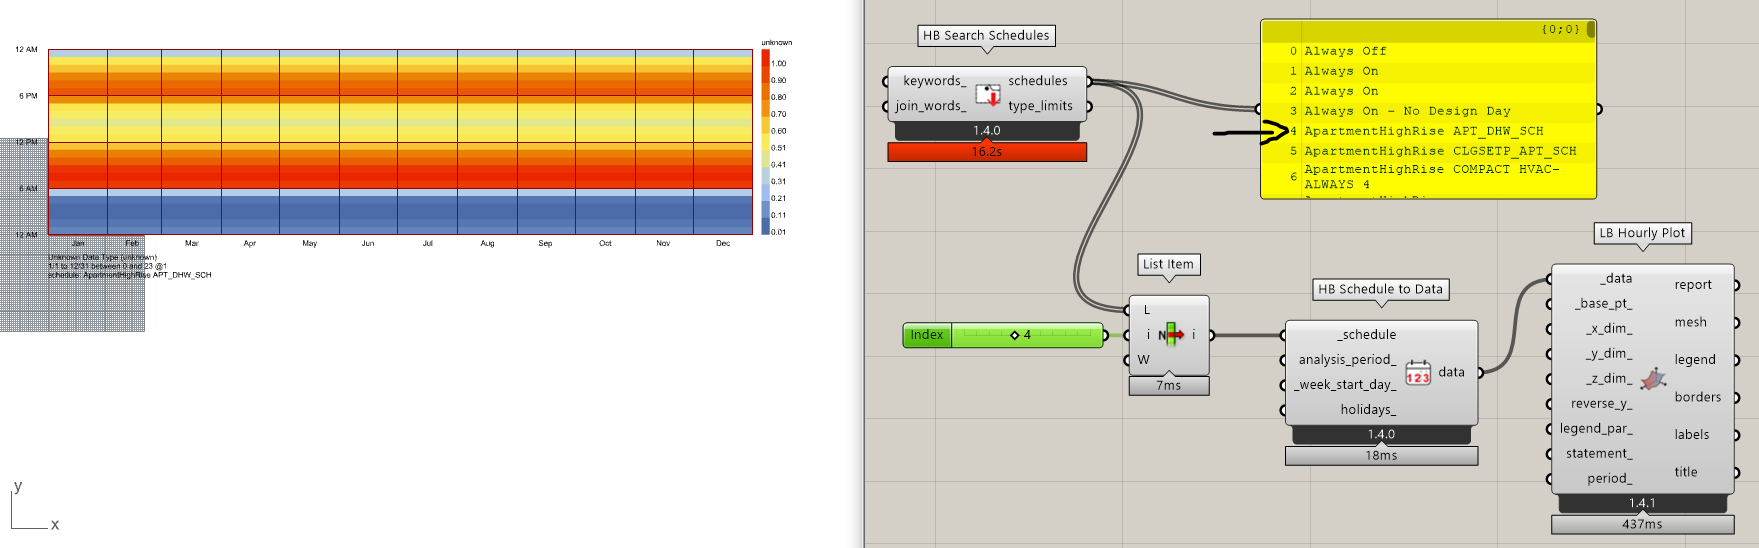
I am not part of the developing team, but if what you want to do is to see inside each schedule which are the values reported you can plot the data of each schedule. In the pic below, I didn’t put any filter but I plotted the data of the 5th schedule in the list.
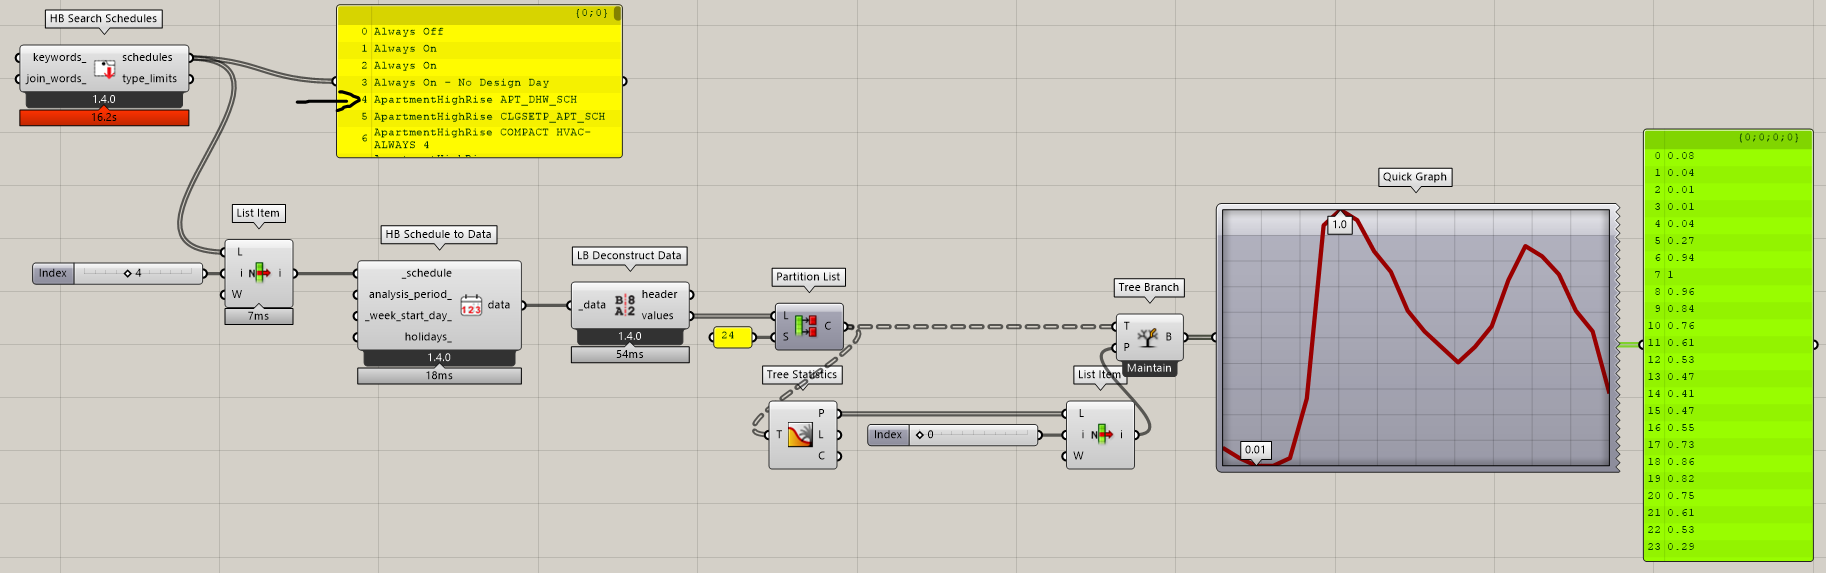
Thanks a lot. We all get it that the schedule has 8760 values indicates 8760 hrs in a year.
So I was wondering in each one of 8760, what is the number changing represent? the full value would be 1 that means 1 hr right? so for instabnce, the number like 0.15, does this mean in a specific one hour, only 15% of it would be occupied?
And as you know, there is quite a lot of schedules with abbreviation, is there any place that we could get the full name so avoid of understanding the schedule solely by the curve, which is confusing.
Hi @TrilithStone ,
I am not sure I understood what you need to know but I’ll try answering. The meaning of the value usually depends on the type of schedule, they are not only related to occupancy. It can also represent things such as setpoints, infiltrations or lighting schedules. As for occupancy, a value equal to 0.25 means that the room considered is occupied by 25 % of the people, so if you have a maximum number of 4 people in that hour you will have 1 person. For other parameters it could also just be the input value for that timestep, e.g. 20°C for the setpoint.
I usually create my own schedules so I don’t have much information on where to find some references. However, I think you can have a look on Github, in the description there are several links to which you can refer to. Anyway, I am not sure there is a better way than having a look at the actual values in a schedule to understand if that schedule suits your needs or not.
@fbattini 's answer is correct, though I realize that a lot of the confusion here is about how the schedules of energy simulation (that tend to be in fractional values of total occupancy) are interpreted into yes/no quantities of occupied hour vs. unoccupied hour for the annual daylight simulation.
If you read the description of the _schedule_ input of the HB Annual Daylight Recipe, it will tell you the answer:
An annual occupancy schedule, either as a Ladybug Hourly Continuous Data Collection or a HB-Energy schedule object. This can also be the path to a CSV file with 8760 rows or the identifier of a schedule in the honeybee-energy schedule library. Any value in this schedule that is 0.1 or above will be considered occupied.
I realize that we didn’t have this issue in the Legacy plugin because people had to define occupancy schedules for daylight using separate components than those for energy. But, in the LBT plugin, we enabled people to plug energy schedules into the annual-daylight recipe largely for convenience and to help people align their energy and daylight simulation assumptions. So this “threshold of 10%” is a pretty new thing that we use to translate the energy occupancy assumptions into something suitable for daylight.