Hello everyone. I am trying to do a post process analysis in excel using the grid data from honeybee radiance point in time output. As earlier years we could directly generate grid based excel sheets (values of points on a plane replicates the points value in excel, example from radiance using ecotect). Do we have any method to generate this type of post processing in excel using honeybee radiance.I am sharing a snapshot of earlier workflow-
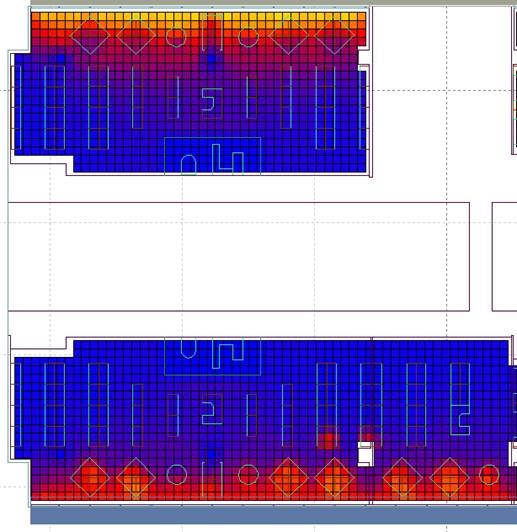
ecotect grid values
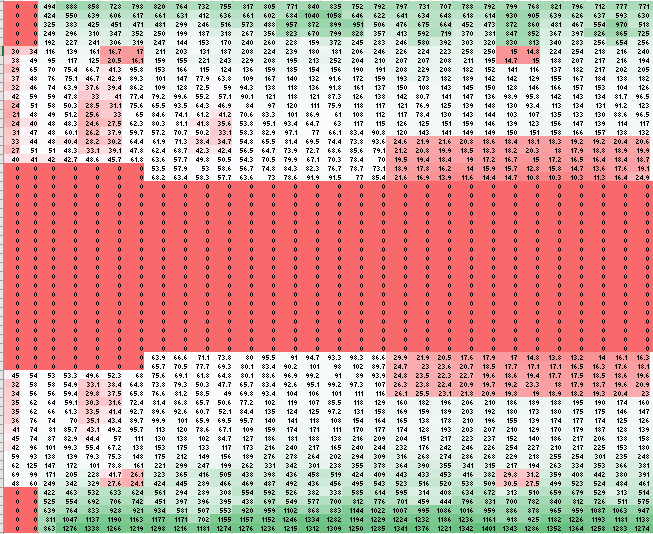
same data in excel grid
This is possible. First, you need to break down the results based on the number of points in each row/column and after that you can use one of the available plugins for writing the results to Excel to generate the results similar to what you posted up there.
Hi Mostapha,
I’m trying to do the same thing and so far have realized that the results need to be grafted.
I’ve grafted the results and grid points from my test daylight results. I tried using TT toolbox to export the data to excel thereafter but the data structure from the grafting wasn’t maintained.
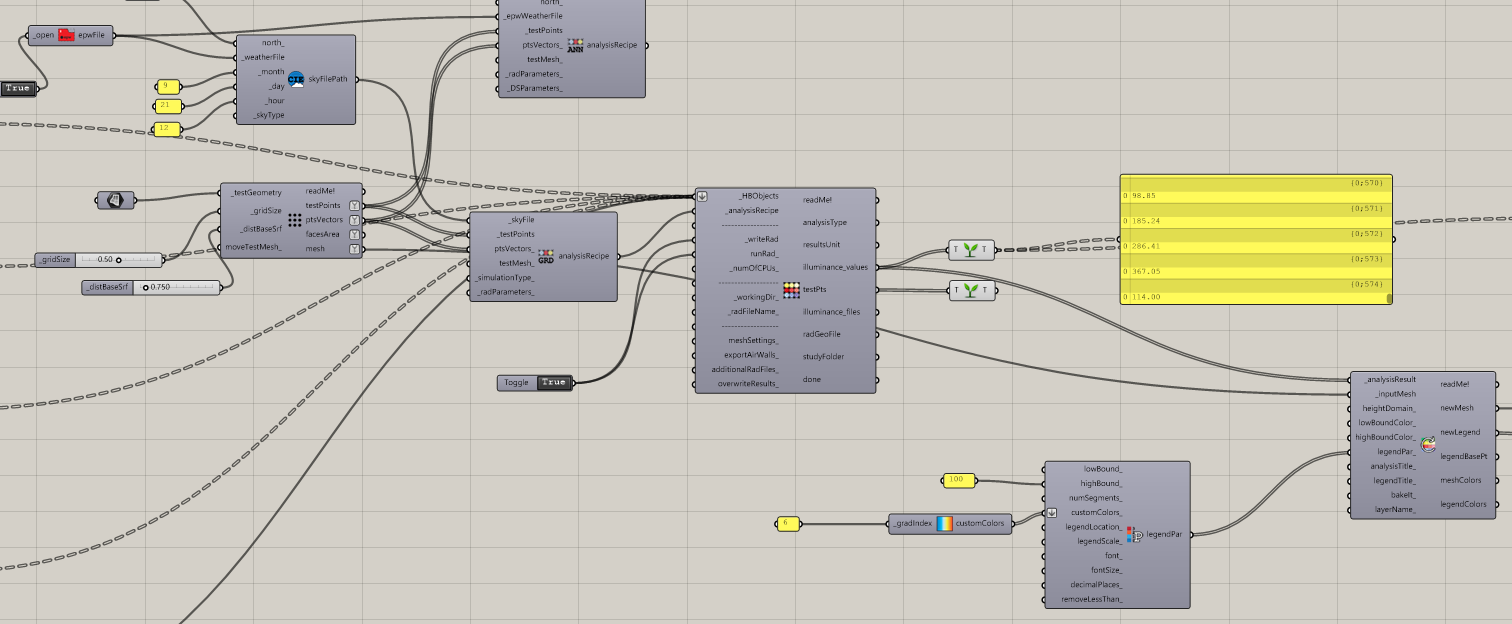
I’m attaching a snapshot of the gh def
Hoping to overcome this!
thanks a ton
Shruti
You should split the list into several list based on the number of test points in each row. Grafting will put every single value in a different branch which is not what you want.
Thanks a ton Mostapha!
will try and revert as soon as possible