Hello everyone,
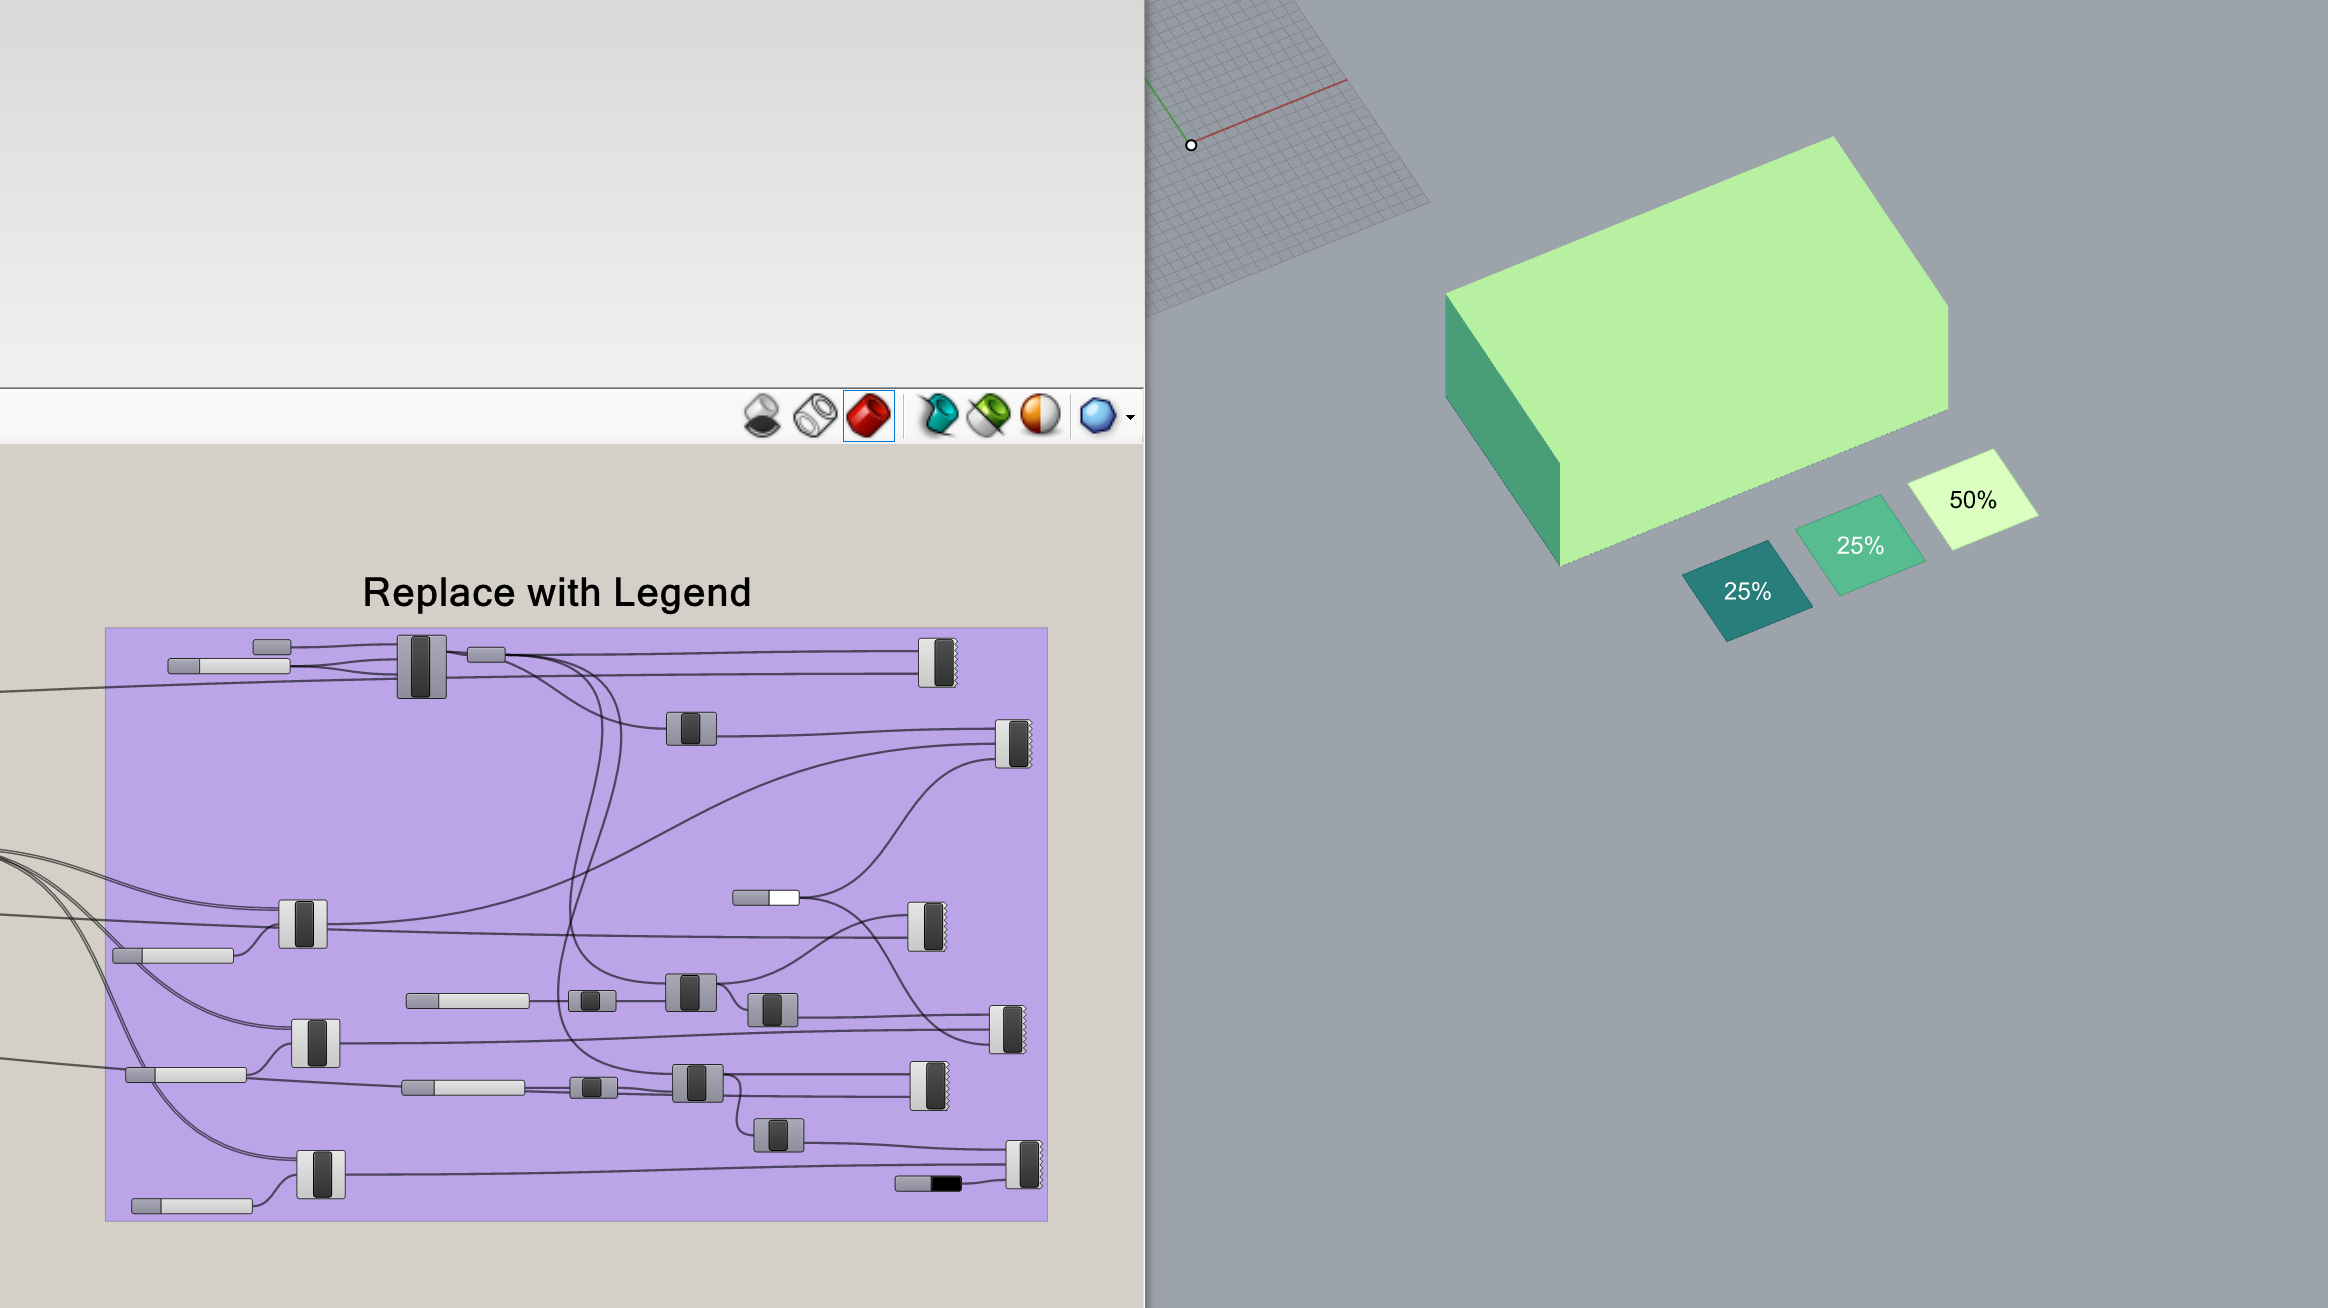
I’m seeking assistance with visualizing the percentage of sunlight exposure on different parts of the building envelope. I’m currently facing difficulty in adding a legend to represent the simulation results effectively. As a temporary solution, I manually created a legend, but it turned out to be too lengthy. Could someone please guide me on creating a simpler and more efficient legend for the results?
Thank you in advance for your help!
Dayligh legend percentage.gh (58.2 KB)