Hi,
We are performing some daylight simulations on specific points in a room.
The room is a single facade, North-East oriented (so it’s getting sunlight in the morning, and from late-morning or afternoon it isn’t getting any direct sunlight at all).
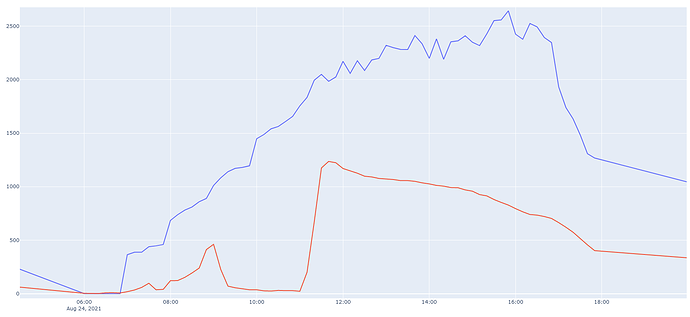
From comparing simulated values with real sensor data that we have gathered from that location in the real room, the simulated values seem to be going higher as the day progresses, which shouldn’t be the case.
The Red line which shows real data from a sensor, and is the more logical trend where you have a ‘spike’ at a certain time when morning light comes in directly into the room via the facade, and later it slowly decreases as the sun progresses West in the sky, away from the facade.
The graph shows real = red, simulated = purple.
The question is, why from 12:00-16:00 there isn’t a slow slope down in the purple line…?
Are there any simulation-based parameters or features that might cause this strange behaviour?
Thanks
1 Like
Hi @YafimSimanovsky, Validating a model against simulation is something that I have done in the past and takes a lot of work.
Am I right that this is the result for a single sensor?
Assuming that is the correct assumption, let’s start with the inputs:
- How did you generate the sky for the simulation? It looks like you are generating a clear sky here. Is this the intention? Ideally, you have the measurements for an external sensor for direct and diffuse irradiance which you can then use as an input to create the wea file.
- What is the timestep for simulation? The changes for the simulated data are more random than what I would expect to happen. Unless you have some random shading pattern the jumps for every 10 minutes or so should not be happening.
- What’s happening between 9-11 am? Is it because of the cloudiness of the sky? This difference tells me that the input wea data hasn’t been generated based on the outdoor measurement.
Once you go through those steps you should start to see a similar pattern between the two. Then it will be a good time to start looking to the values for the interior room faces and how they match the reality to get them to match.
Hi Mostapha,
Thank you for the reply.
With regard to the points:
-
The sky should be generally clear, yes.
We used a “regular” EPW file to create a Honeybee_Generate Climate Based Sky, but I’ve tested this particular day now with an EPW file that contains ‘modified’ real world GHI and DHI values, but the results are the same so I think on this day both EPW and modified EPW have a clear sky which produces roughly identical values from the simulation…at least for this day.
Perhaps a different sky model should be used…?
-
Timestep is 10 minute, so it should be fine.
-
We’ll need to check.
Any thoughts?
Thanks!
For validation work I recommend using continuous climate-based sky and run the studies for every single timestep as a point-in-time simulation.
Also WEA file which is used for generating the cumulative sky doesn’t use the global horizontal irradiance.
