Daylight visualization - interpolating/smoothing values between grid points

Hi.

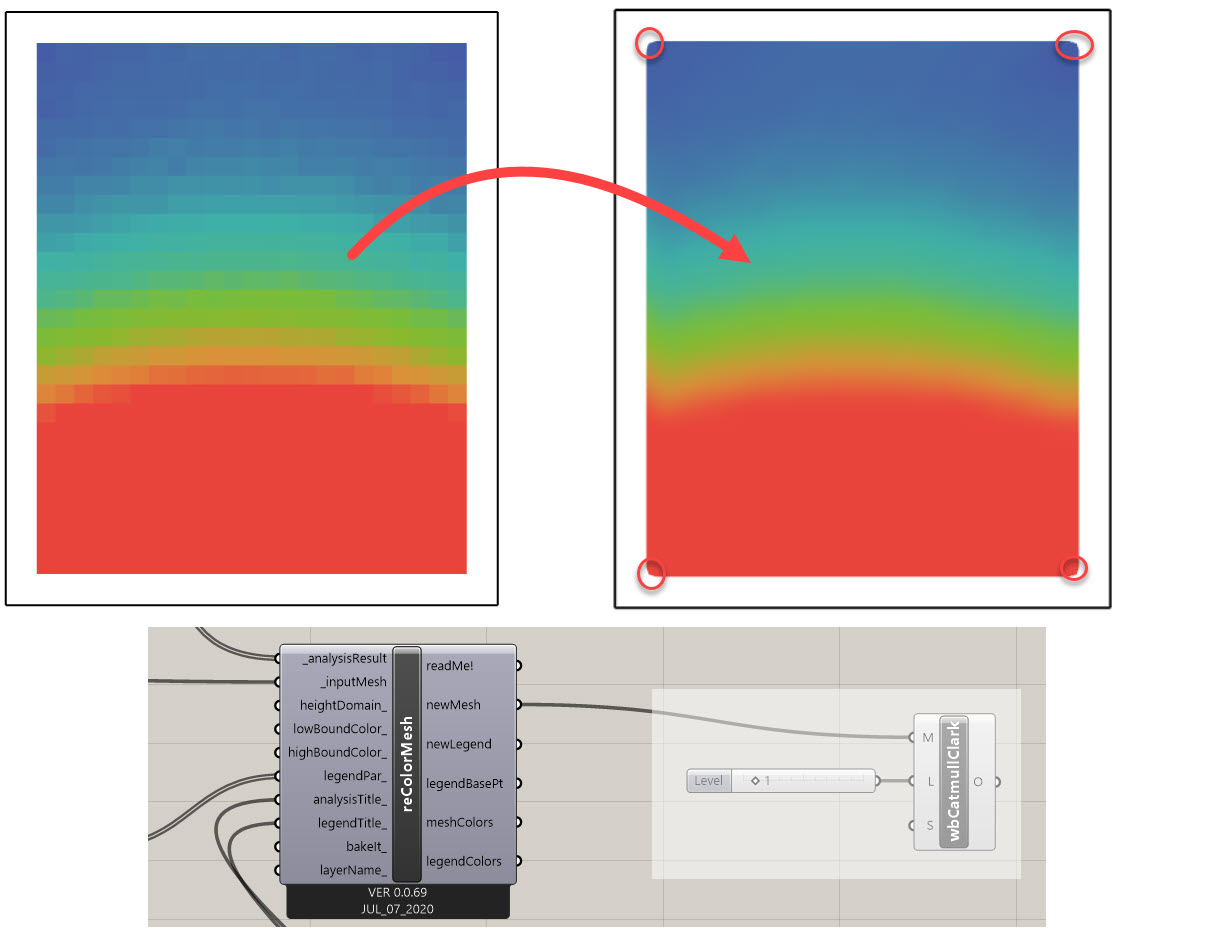
In some cases it would be nice to be able to present “smoothed” daylight analysis grid, in stead of “pixelbased” graphics (like shown in the attached picture).

I got a great tips from @mostapha to use the plugin “Weaverbird”, that solved this quite nice.
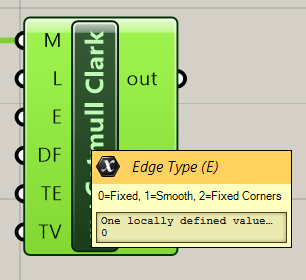
However. I get some unwanted edge-effects.

Do someone have a quickfix to this issue?

Hallo EspenHansen,

Weaverbird has another component called “m+Catmull Clark”, who does the same job.
Look the E (EdgeType) input, which allows you to have curved or angular corners.
Weaverbird

Greetings

@LaFleur Thank you! :slight_smile:

with pleasure :slight_smile: