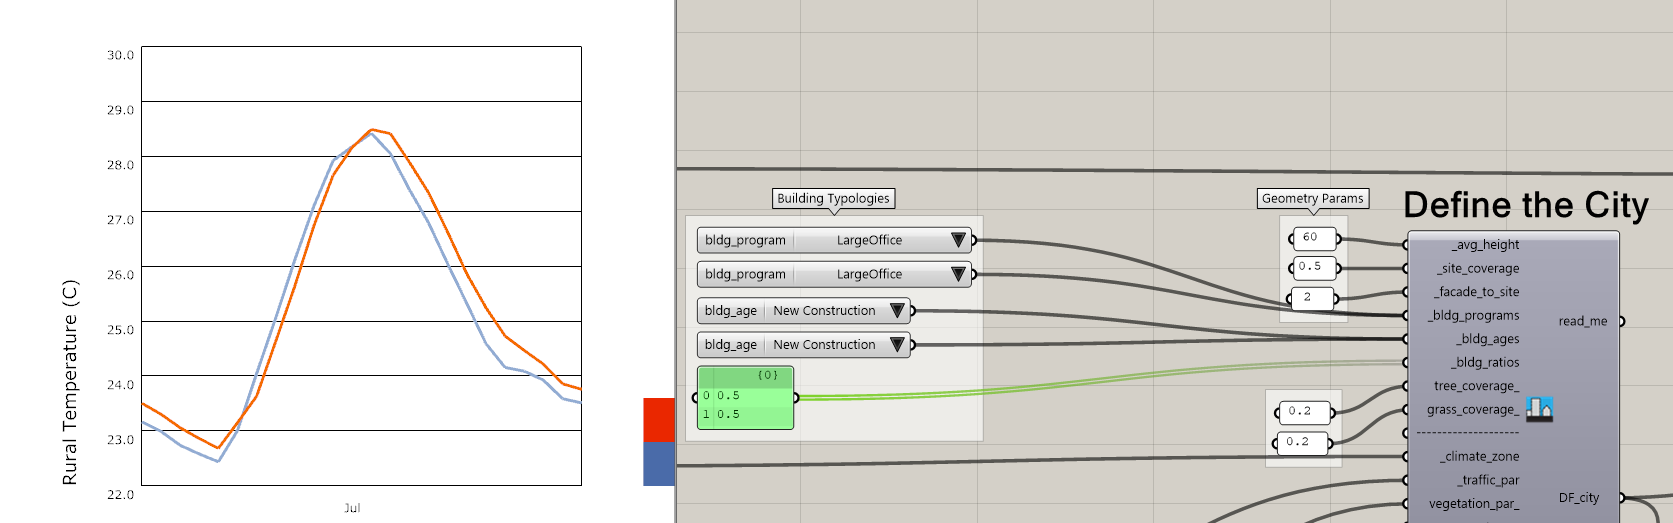
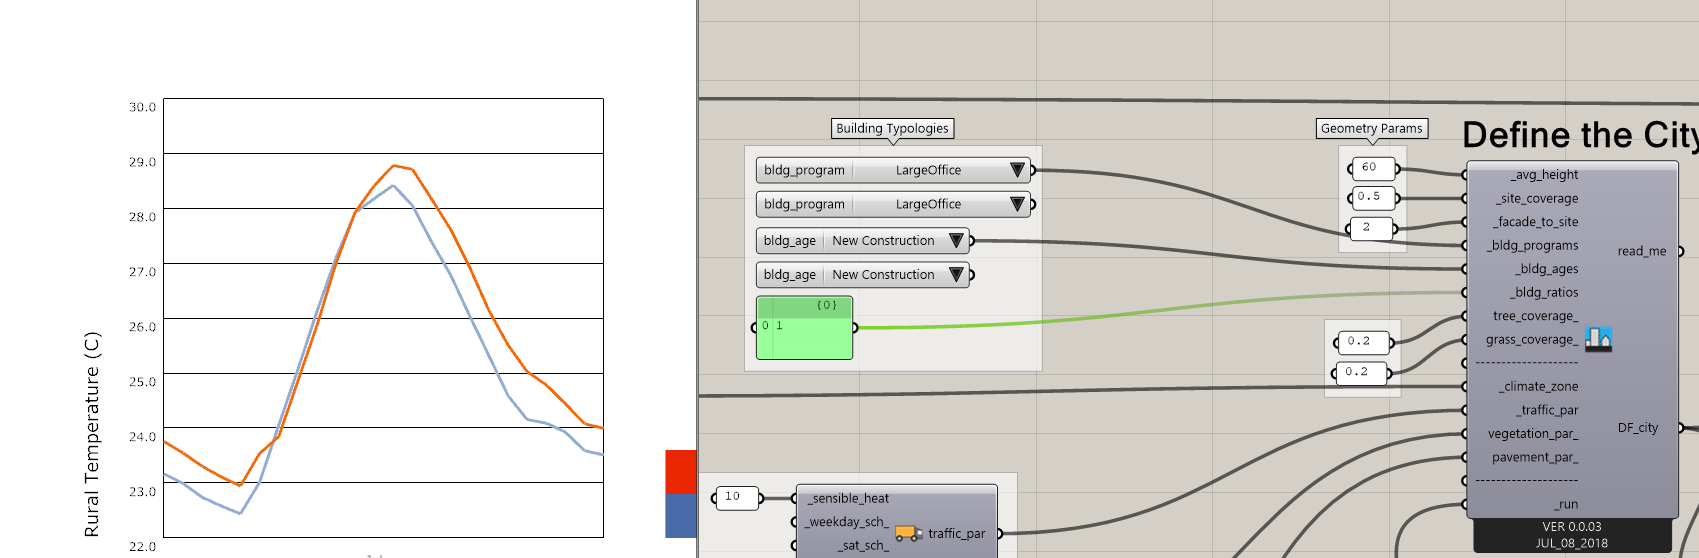
If I consider the default .gh file uploaded by @chris and used with DF Legacy 0.0.03, I obtain a certain difference between rural and urban site on the average monthly hour Dry Bulb Temperature (DBT) data:
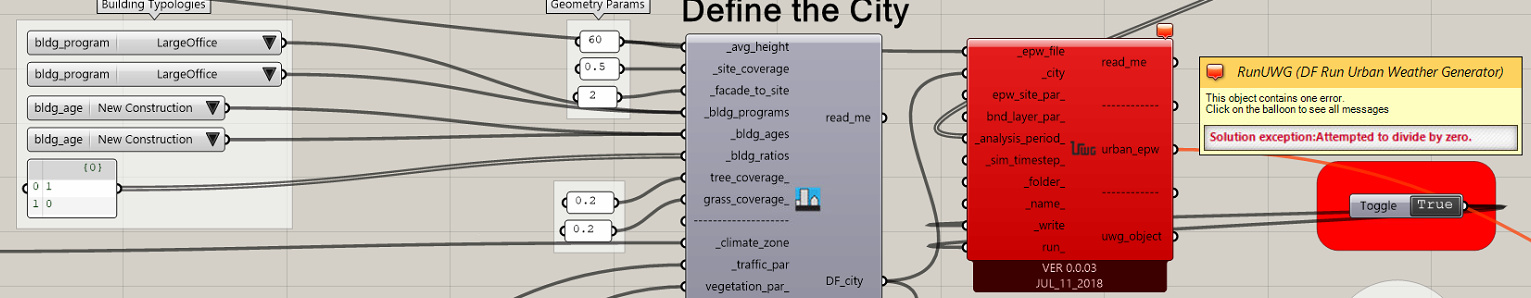
If I try to reduce the urban building geometry (site coverage 0.01), set to 0 the antropogenic sensible heat and set the vegetation coverage of the rural area equal to that of urban area, I obtain this:
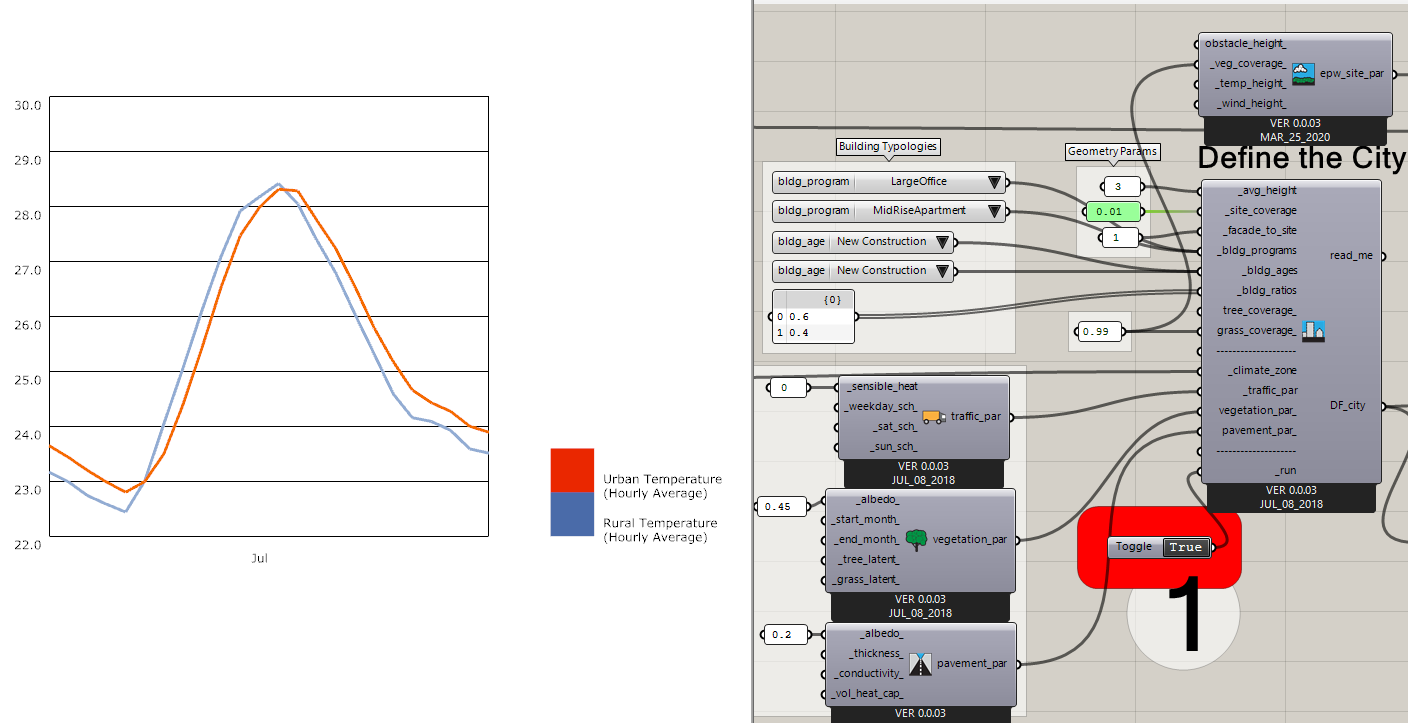
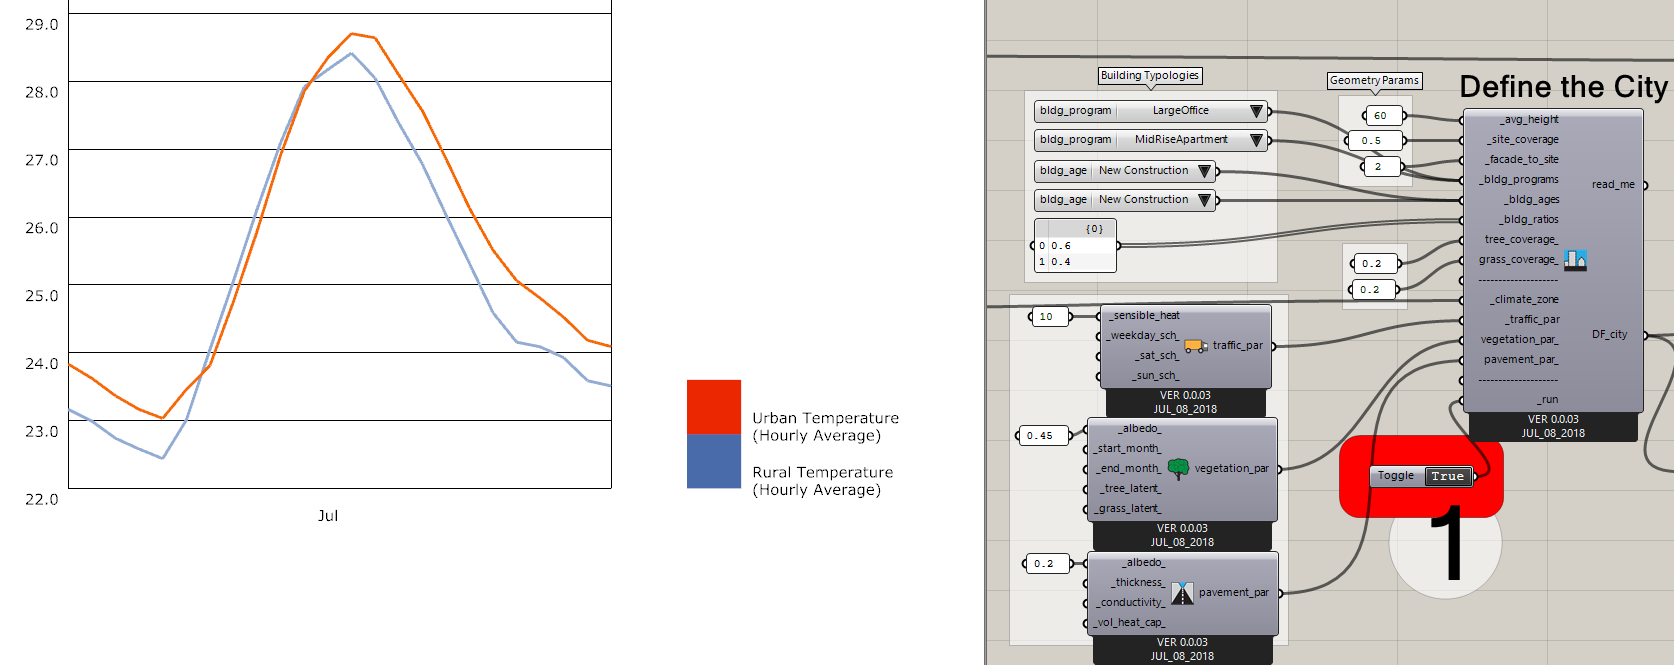
The difference in terms of DBT is more than 0.5 in the left part of the graph (avrMonthlyPerHour) and there is no particular evidence of the difference with the previous case. Could you explain why?