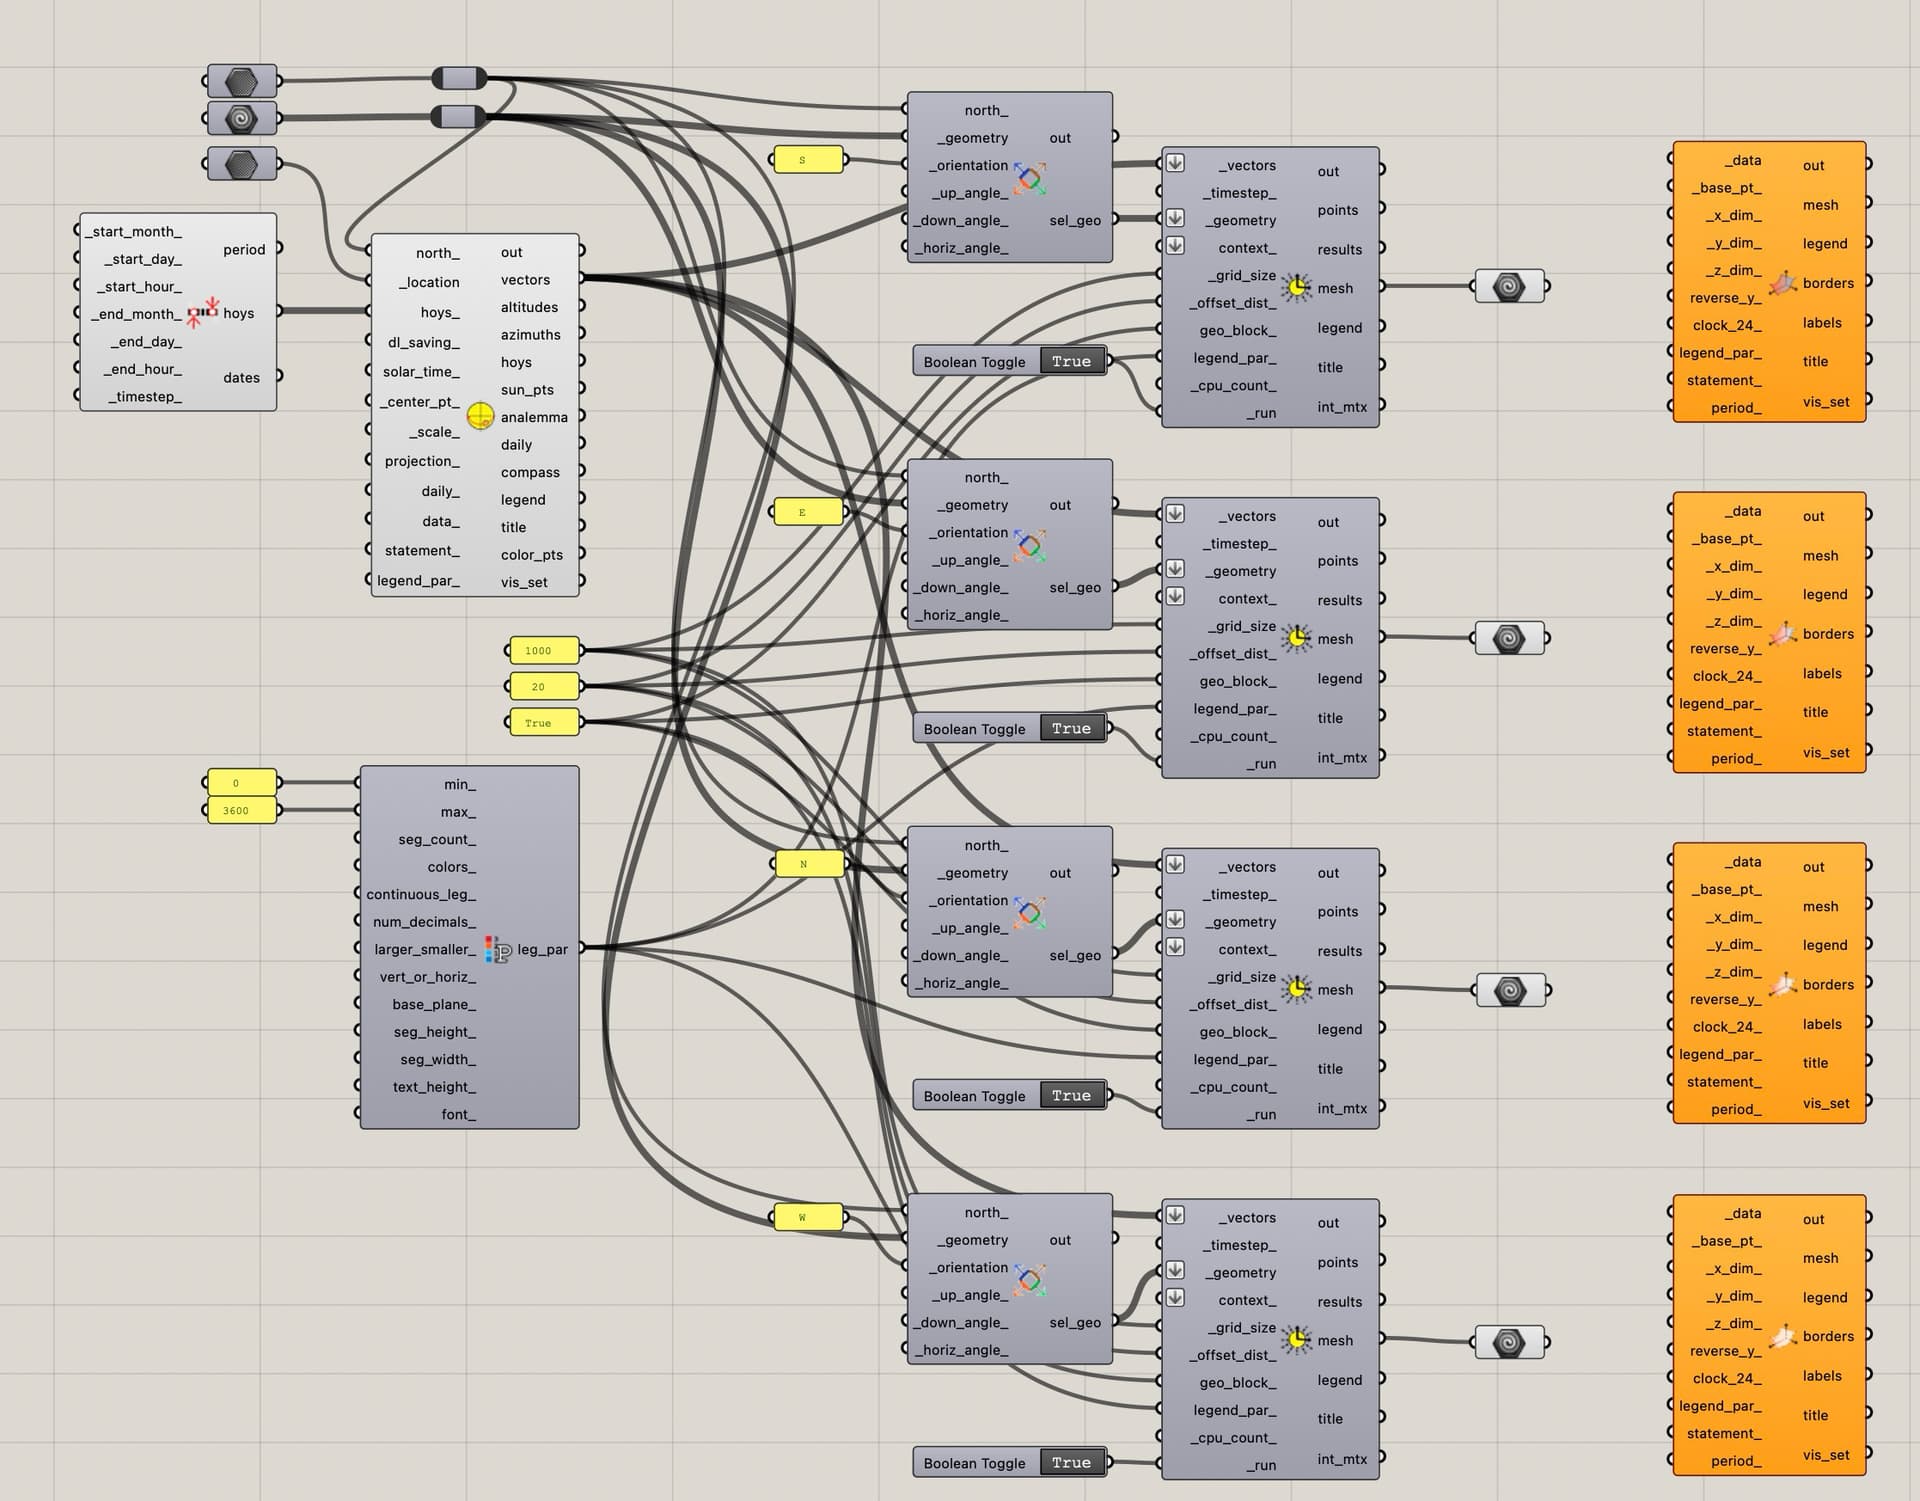
I’m trying to create an 8760 visualization to show when direct sunlight hits 4 different facade orientations in separate hourly plots, but I’m struggling to connect LB direct Sun Hours to the LB Hourly Plot component…
Any hints or suggestions would be most welcome
thanks!
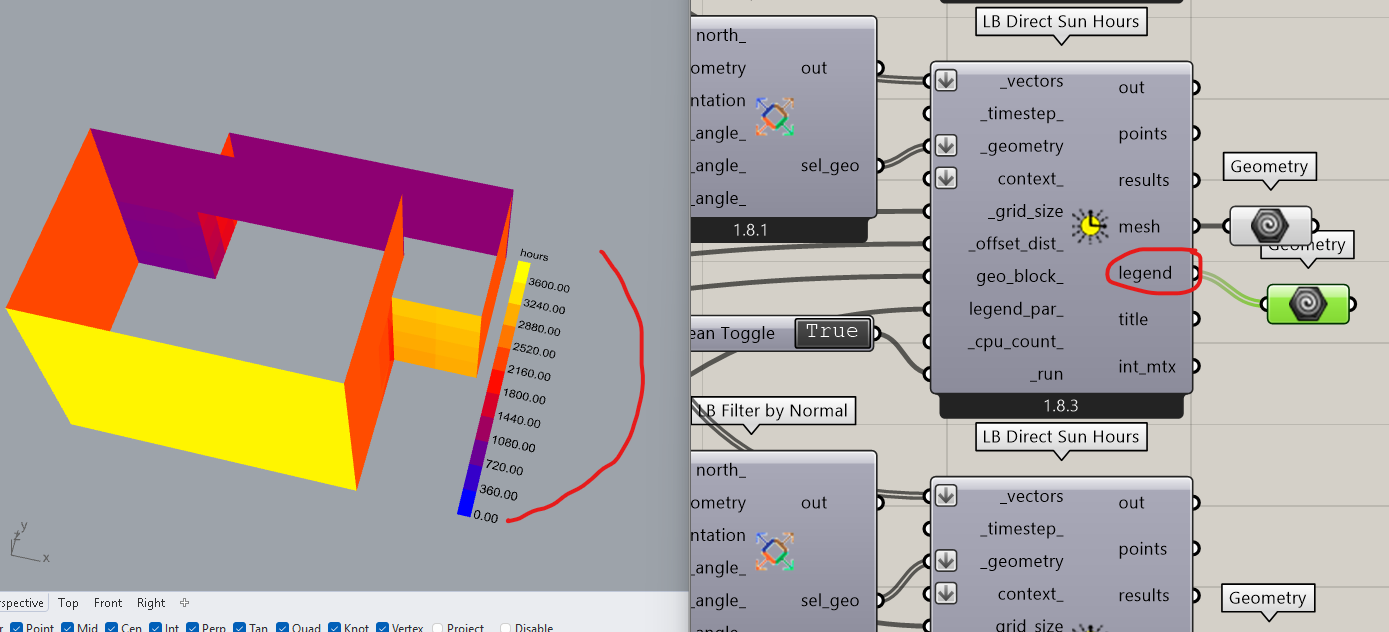
Thanks @TrevorFedyna, I do like the build-in heat-map on the facade, but I’m trying to add an hourly plot to show when during the day and year that the facade orientations come into play… the combination of the spacial map on the building and the hourly map would be a helpful communication tool to understand quantity and time…
How would you determine if a facade is hit by direct sunlight for a given hour? I ask because part of the facade might be in shade while the rest is hit by sunlight. Does it count if part of the facade, e.g. a single sensor, is hit by the sun? Does it count if half of the facade is hit by the sun?
I might be able to suggest something if you can define the threshold.
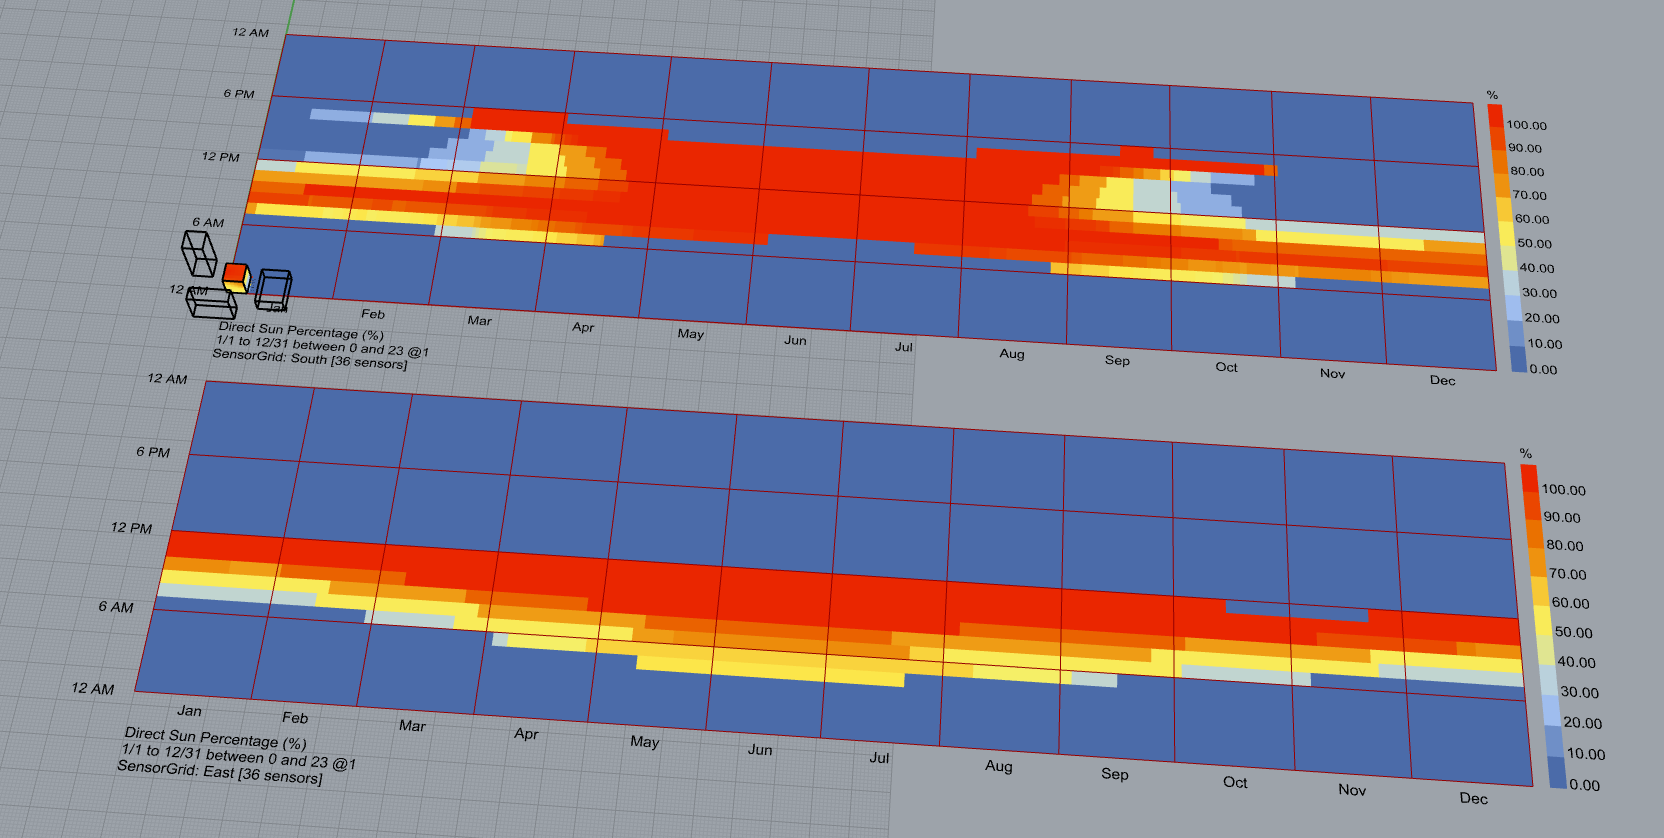
Hi @mikkel , that is a very good question as they say… my thinking has been to generate a % of sensor points output and then use the cut-off and legend colours on the yearly viz to show how much of the facade is receiving sun every hour
You have to use HB Direct Sun Hours to get the hourly results. You can then pass the results through HB Annual Results to Data to generate a data collection of each sensor. When you have the data collections you can flip the matrix and sum the exposed sensor for each hour, and to get the percentage you divide with the number of sensors.
In the attached file I use the mesh area to calculate the percentage instead of counting the sensors, but I also added a simplified method that just counts the number of sensors.
Since we rely on HB Annual Results to Data it will not scale well if you have many sensors.
Thank you @mikkel !
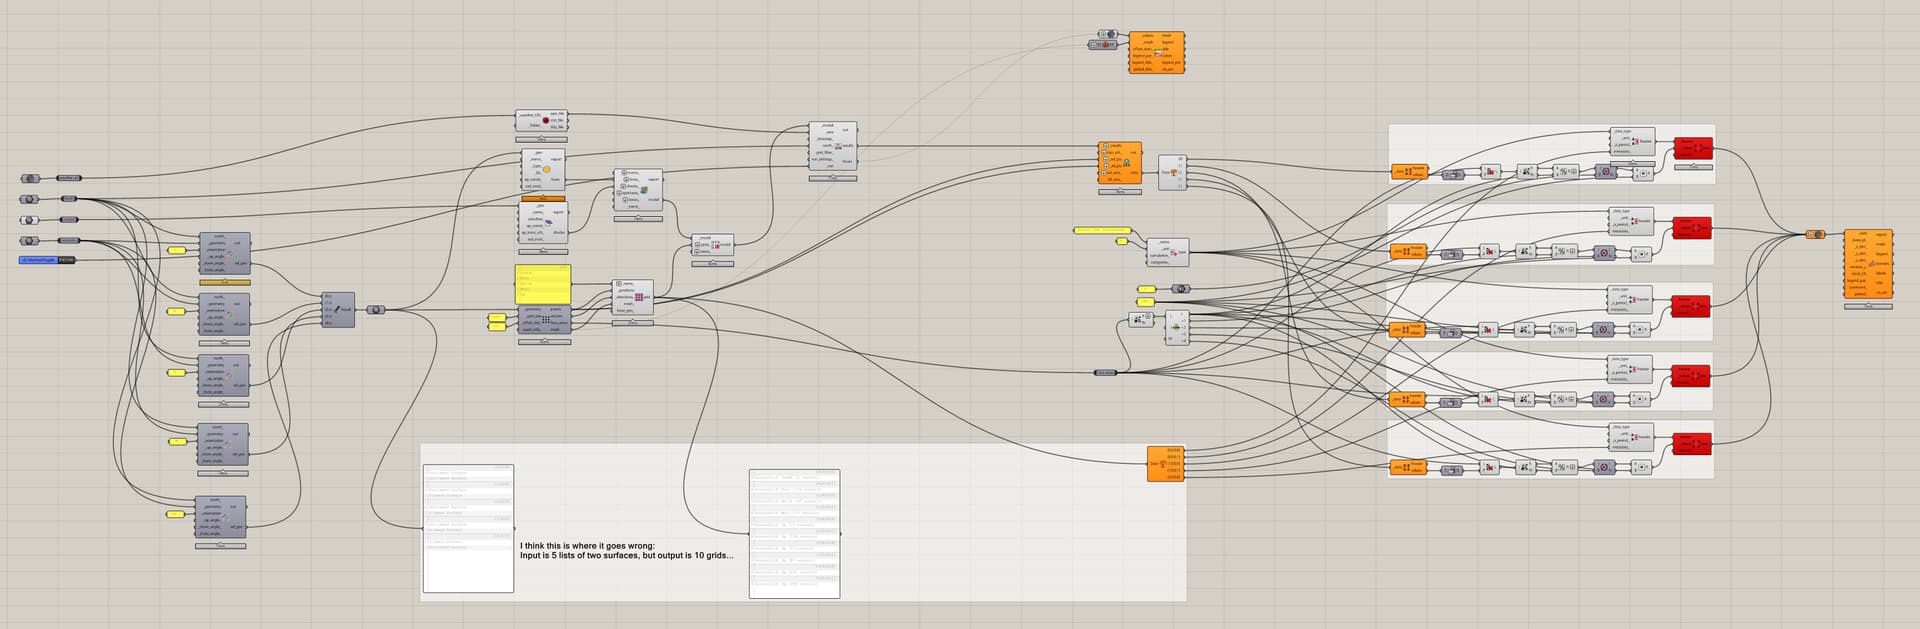
This is super helpful and just the visualization that I was trying to achieve…I’m trying to combine it with ‘LB filter by Normal’ to automatically group surfaces, but are having some problems aligning trees…I think.
When I input 5 lists of 2 surfaces into the ‘LB Generate point grid’ components I get 10 separate lists and I don’t know how to keep the structure etc… Any thoughts? sun hours on multiple surfaces- problem1.gh (95.8 KB)
If you don’t want to deal with the data tree structure there is a workaround. In any case we want to merge the faces into 5 grids in your example.
The workaround is to merge the geometry before we create the grids. You can do this by running LB Generate Point Grid twice. The first time we use it just to generate the meshes. We flatten these meshes and partition the list based on the length of each orientation (2 surfaces for each in the example). We can now merge these meshes so we get one mesh representing South, East, etc. When we run these meshes through the grid generator the second time you get the structure that you want. The second time we do it the _grid_size and _offset_dist_ are irrelevant since it will use the mesh data.
You can also use the native component, Path Mapper or Trim Tree, to restructure the output from the grid generator. In this case we merge the data (points, vectors, face_areas, mesh) after generating the grids. I added this at the bottom of your canvas.
Also, you should not flatten the _all_pts input in HB Annual Results to Data. It needs the original data structure to work correctly.
Thank you again @mikkel !
I did not know that I could do this with ‘Path mapper’, I was looking for some way to combine the two sub branches, so I’m sure this new understanding will come in handy in the future.
I have to deal with the data trees to make the script more useful when there are variable number surfaces in the different orientations…is there a way to automatically handle that in Path mapper or do I have the specify this on a case by case basis ?
Hi @mikkel ,
I’m trying to wrap my mind around the Pathmapper, but struggling and not getting the results that thought.
From our previous exchange I understood that {A;B} > {A} would add up the ‘B’ sub branches in to the new ‘A’ top branch.
When I use this logic on the tree coming from ‘HB Annual Irradiance’ via ‘LB Deconstruct Data’ Values output… it doesn’t seem to work for me.
Each surface has multiple sensors with their own hourly data that I need to collapse into one shared hourly data set for the year that I can graph for all the surfaces together…
What am I missing regarding the ‘Graphmapper’ usage and how do I use the it (or another component) to achieve this?